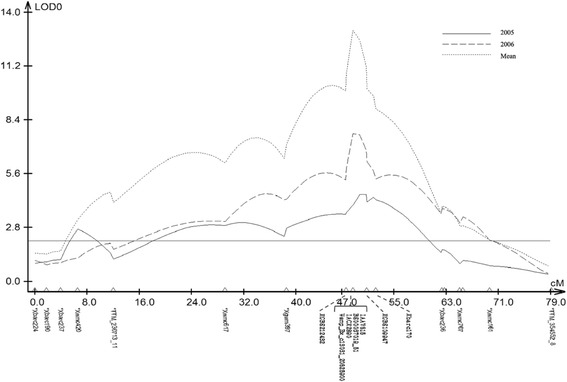
Fig. 4.

Interval mapping (IM) of a quantitative trait locus (QTL) for pre-harvest sprouting (PHS) resistance on chromosome 4A using SSRs, GBS-SNPs and SNPs identified from genome-wide association study (GWAS). The line parallel to the X-axis is the threshold line for the significant LOD value of 2.42 (P < 0.05). Genetic distances are in centiMorgans (cM)
