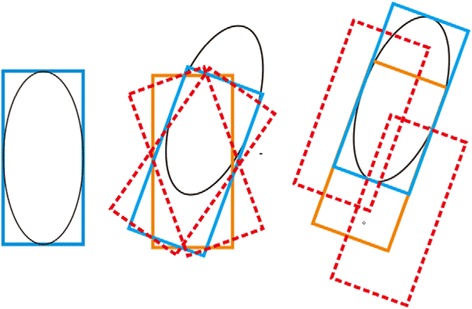
Fig. 3.

Schematic diagram of the tracking process. The tracking object is indicated by an ellipse; the blue box represents the best tracking area of the current step; the orange box represents the location of the tracking box in previous steps; the red dashed boxes represent the candidate regions. The best region is selected from the candidate regions
