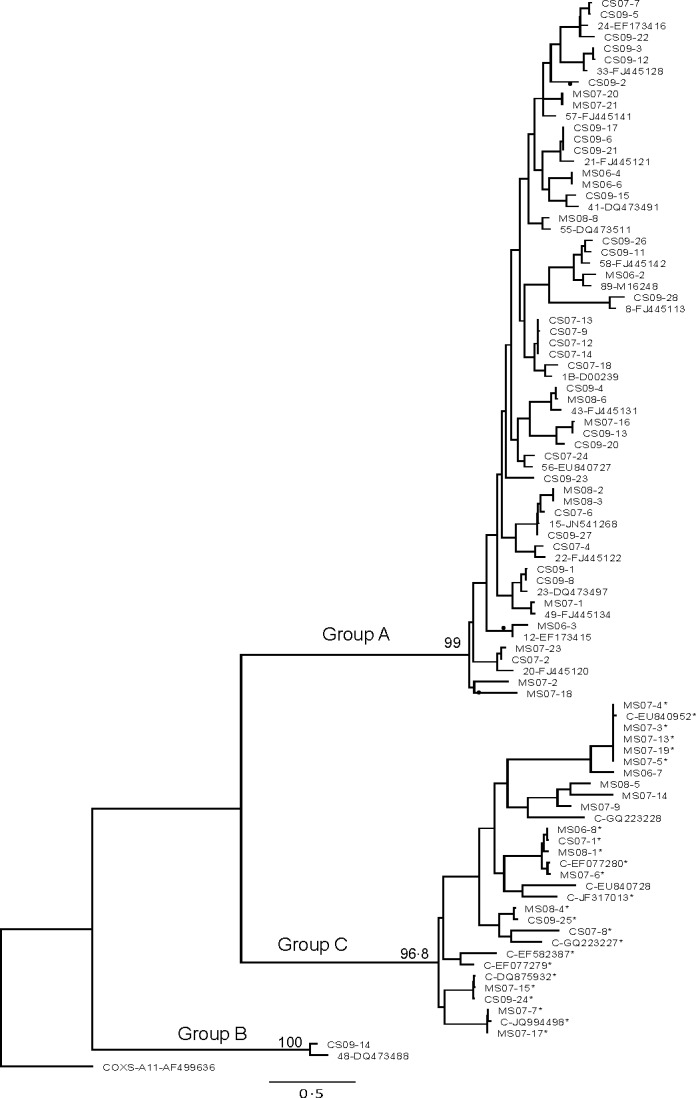
Figure 2.

Maximum‐likelihood tree of the VP4/VP2 coding region, showing relationships of clinical strains, newly described strains and prototype strains of HRV (constructed as described for Figure 1). Samples with asterisk (*) denote strains that grouped as C in the VP4/VP2 region, but grouped with HRV A species. Samples with only 5′UTR sequences are denoted by ^. Discordant branches in the VP4/VP2 and 5′UTR sequences are indicated by ●
