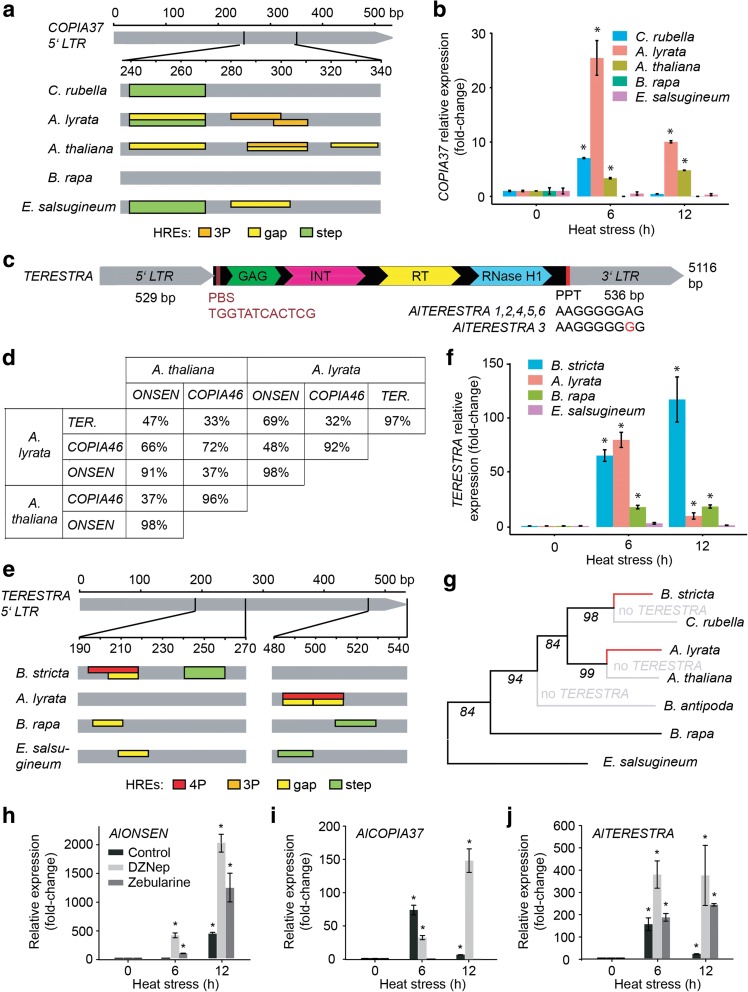
Fig. 3.
COPIA37 and TERESTRA are novel heat-responsive COPIA families. a In silico reconstruction of putative HREs in the 5’ LTR of COPIA37 in different species. HRE classification follows criteria proposed by [20]. Colored boxes spanning the entire height of the gray field indicate HREs found in ≥50 % of the heat-responsive copies in A. thaliana and A. lyrata or all copies in other species. The lower boxes represent less frequent (<50 %) HREs. Detailed information including sequences underlying individual HREs can be found in Additional file 5: Figure S5. b Transcript levels of COPIA37 in Brassicaceae after 6 and 12 h 37 °C HS. The values were normalized to transcript levels of UBC28. Error bars indicate standard deviation between three biological replicates and * P <0.05 in Student’s t-test. c Schematic representation of A. lyrata TERESTRA (TERESTRA). LTRs are indicated in gray. Capsid protein (GAG), integrase (INT), RT, and RNAse H1 domains are shown within the light-blue-labeled TERESTRA protein-coding part. Primer binding sequence (PBS) and polypurine tract (PPT) are indicated by red boxes. d Sequence similarities within pair-wise LTR alignments between A. lyrata and A. thaliana TERESTRA, ONSEN, and COPIA46 families. More than 70 % similarity was expected for members of the same family. TERESTRA is absent in A. thaliana. e In silico reconstruction of putative HREs in the 5’ LTR of TERESTRA. The criteria were as described for Fig. 3a. Detailed information including sequences underlying individual HREs can be found in Additional file 5: Figure S9. f Transcript levels of TERESTRA in response to 6 and 12 h 37 °C HS in different Brassicaceae. The experiment was performed as described in (b). g Reconstruction of TERESTRA HRE evolution. The phylogenetic tree was developed using a chalcone synthase gene of each individual species. The numbers at the base of the branches indicate bootstrap values. Black lines show species with low efficiency HREs and red lines highlight independently evolved high efficiency HREs in A. lyrata and B. stricta. Gray lines denote species where TERESTRA could not be found. TE transcript accumulation of (h) ONSEN, (i) COPIA37, and (j) TERESTRA after 0, 6, and 12 h 37 °C HS preceded by 48 h control (no inhibitor), 10 μM 3-deazaneplanocin A (DZNep), or 40 μM zebularine treatment. Transcript amounts were normalized to UBC28 mRNA and signals from drug and heat-treated samples were recalculated as fold-changes relative to 0 h. Error bars indicate variation between two biological replicates and * P <0.05 in Student’s t-test

