
Figure 3.
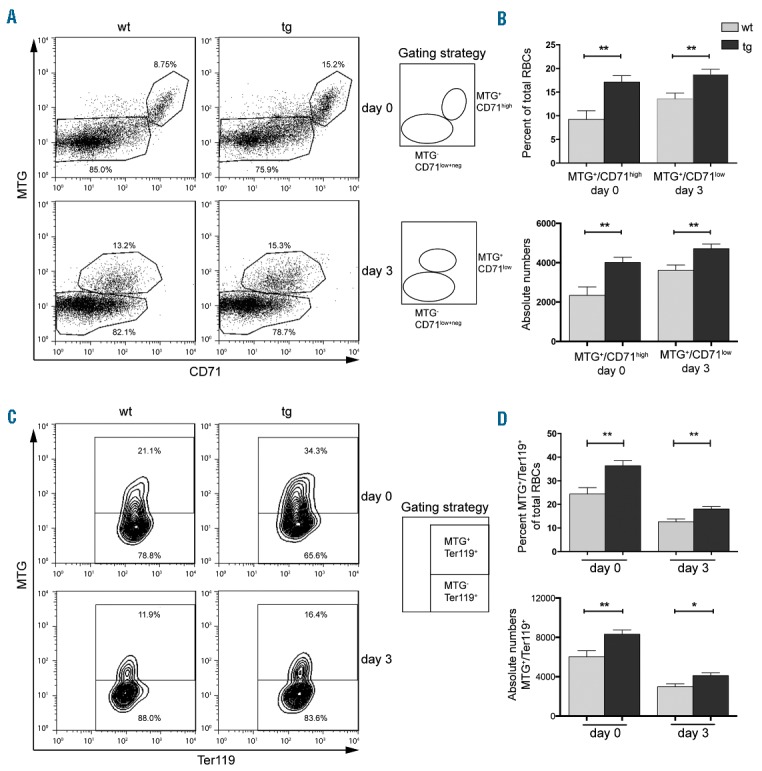
Delayed clearance of mitochondria from Ter119 and CD71 positive newly formed reticulocytes in NF-E2 tg mice. (A, C) Representative FACS analysis and gating strategy for one wt and one tg animal for day 0 and day 3 staining for (A) MTG and CD71, (C) MTG and Ter119. (B, D) Percentage and absolute numbers per 10.000 measured events (per 3 μl whole blood) of stained cells in NF-E2 tg and wt mice on day 0 and day 3 of ex vivo maturation: (B) MTG+/CD71high (day 0) and MTG+/CD71low (day 3), n= 8 wt, n= 7 tg (4 strain “9”, 3 strain “39”); (D) MTG+/Ter119+, n= 8 wt, n= 7 tg (4 strain “9”, 3 strain “39”). Histograms show mean and SEM. *P<0.05, **P<0.01. Statistical significance was calculated by Student’s t-tests.