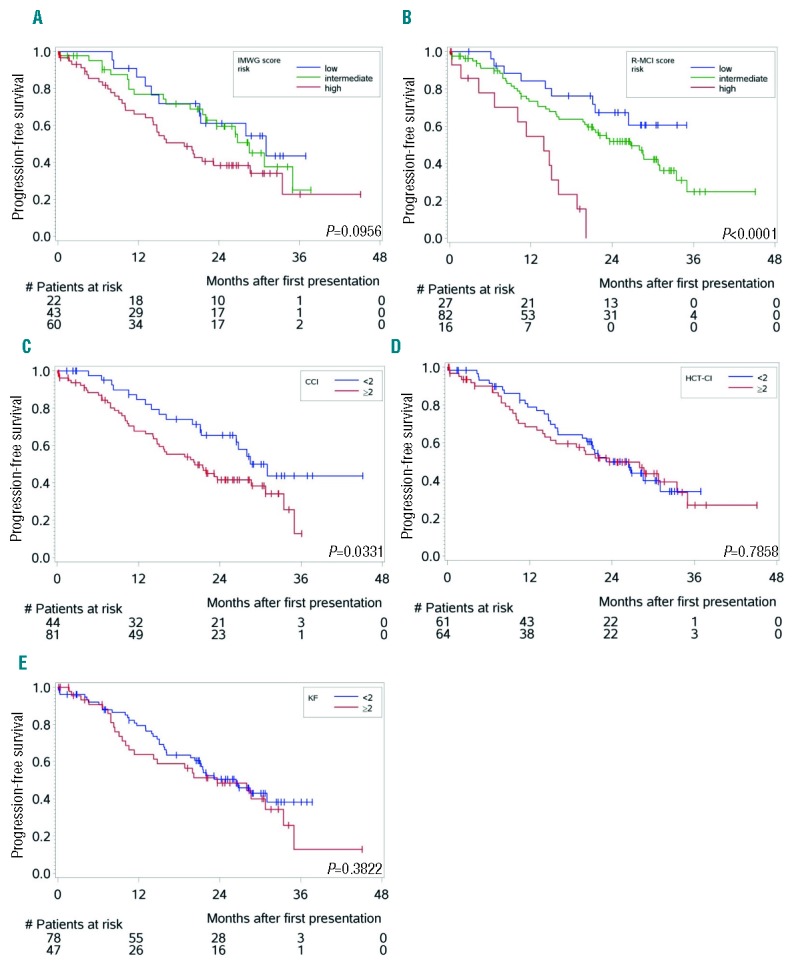
Figure 1.

Kaplan-Meier estimates for progression-free survival (PFS) (n=125) according to different comorbidity scores [P-values; log-rank test]. (A) PFS in our patients divided into fit, intermediate-fit and frail patients showed group differences between both fitter patient groups and frail patients using the IMWG score. (B) PFS according to the R-MCI revealed better group distinctions between fit, intermediate-fit and frail patents. (C–E) PFS according to CCI risk groups again showed significant difference, whereas these were undetectable with the use of both HCT-CI (D) and Kaplan-Feinstein (E).
