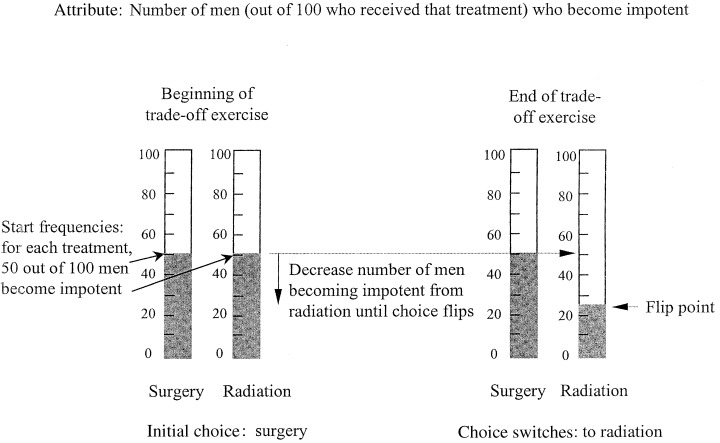
Figure 2.

A schematic of an example trade‐off exercise. The two vertical bars on the left show the number of patients (50 out of 100) treated with radiation treatment and (50 out of 100) treated with surgery (left and right, respectively) that become impotent after the respective treatments. The patient then chooses, given those numbers and everything else he has been told about the two treatment options, which treatment he would prefer. In this example, the initial choice is surgery. The number of patients treated with radiation who develop impotence is then systematically dropped until radiation becomes the more appealing option and the patient ‘flips’ his choice. The example shows the ‘flip point’ at 25.
