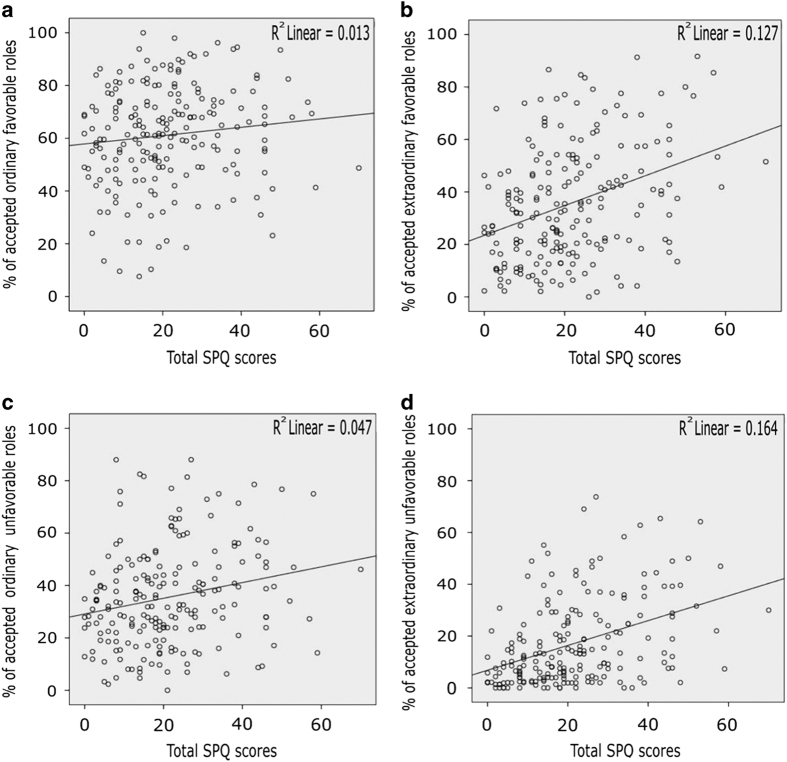
Figure 1.
(a–d) Percentages of roles accepted in each category combination according to SPQ scores. Each small circle represents a participant (n=203). Its ‘x’ coordinate is his/her SPQ score and the ‘y’ coordinate is the percentage of roles (s)he accepted for each category. Scatterplots are for (a) ordinary favorable roles, (b) extraordinary favorable roles, (c) ordinary unfavorable roles, and (d) extraordinary unfavorable roles. SPQ, schizotypal personality questionnaire.

