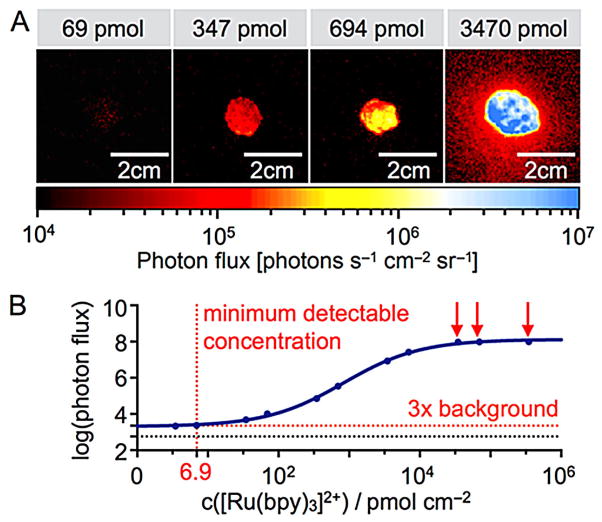
Figure 3.
Determining ICI sensitivity. A) Signal intensities at various concentrations of [Ru(bpy)3]2+ immobilized on a microscope slide after spraying on a mixture of (NH3)2Ce(NO3)6. B) Quantification of the imaging signals collected in panel A. The detection threshold (dashed line) was defined as 3× the background noise. Red arrows indicate concentrations at which the camera was saturated.

