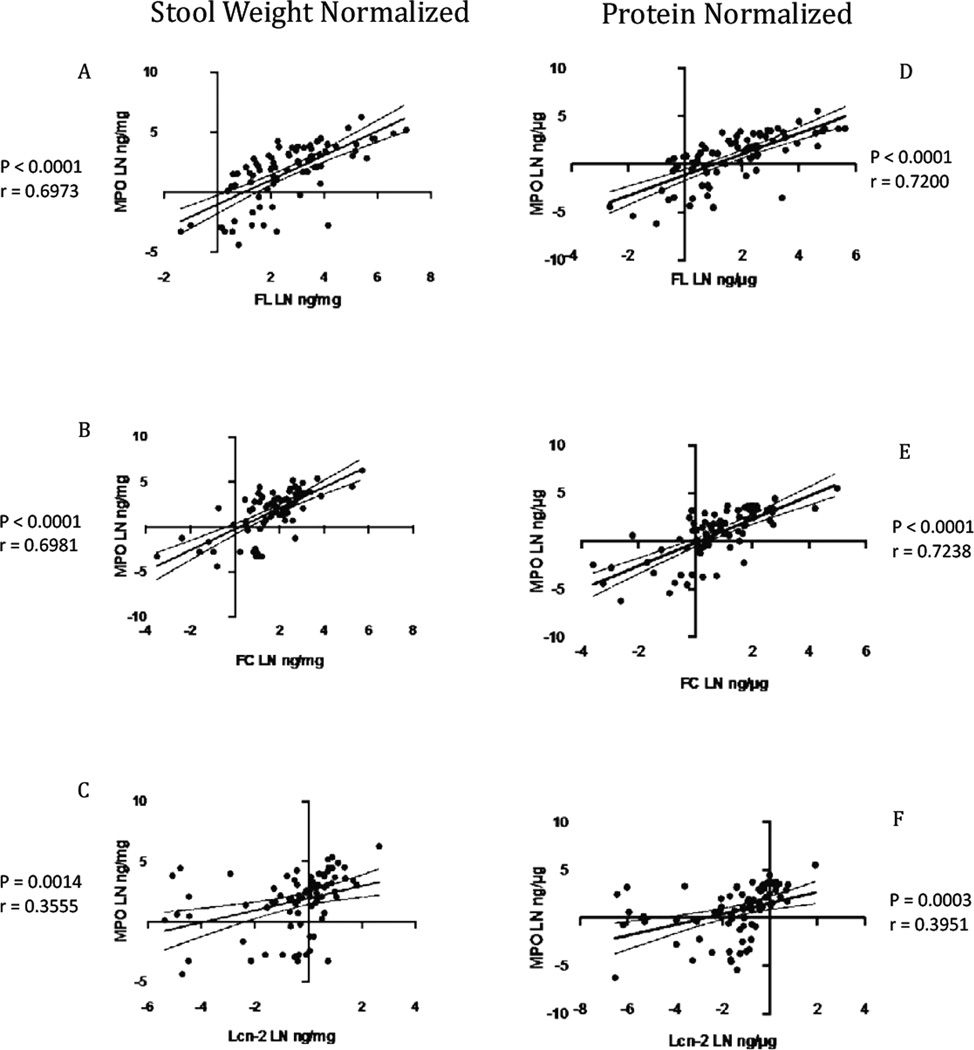
Figure 1.
Pearson correlations of the natural log transformed (LN) between fecal MPO and the other biomarker with stool weight normalized and protein normalized in samples from malnutrition children. Stool weight normalized: (a) FL (P<0.0001; r=0.6973) (b) FC (P<0.0001; r=0.6981) (C) Lcn-2 (P=0.0014; r=0.3555). Protein normalized: (d) FL (P<0.0001; r=0.7200) (e) FC (P<0.001; r=0.7238) (f) Lcn-2 (P=0.0003; r=0.3951). MPO indicates fecal myeloperoxidase; FL, lactoferrin; FC, calprotectin; Lcn-2, lipocalin-2. The solid line represents the linear regression line, and the dashed curves denote the 95% confidence interval.

