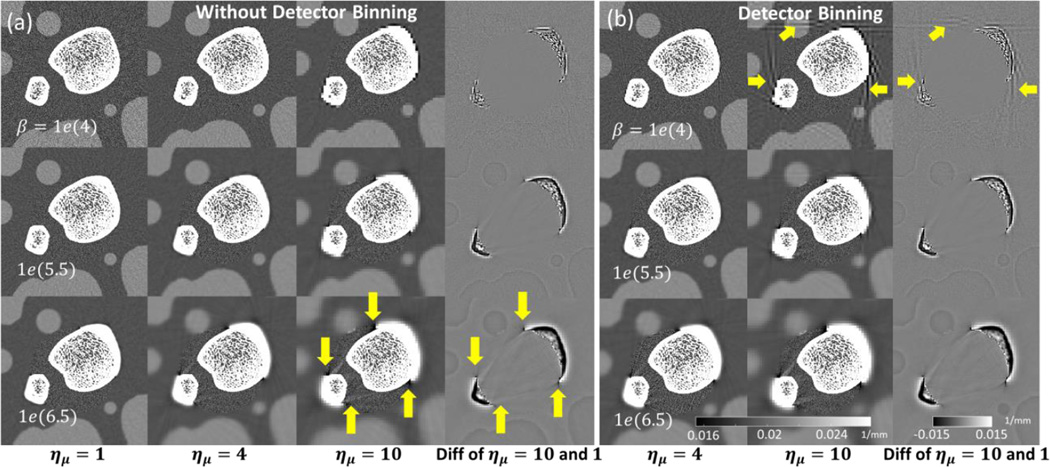
Figure 5.
Multiresolution PWLS reconstructions for different downsampling factors and coarse grid regularization values. A central region of the digital phantom is shown for PWLS without detector binning (a) and with detector binning (b). The last column in each subfigure is a difference image between the case with maximal downsampling (ημ = 10) and the case of no downsampling (ημ = 1). Arrows indicate artifacts due to strong coarse grid downsampling and regularization.

