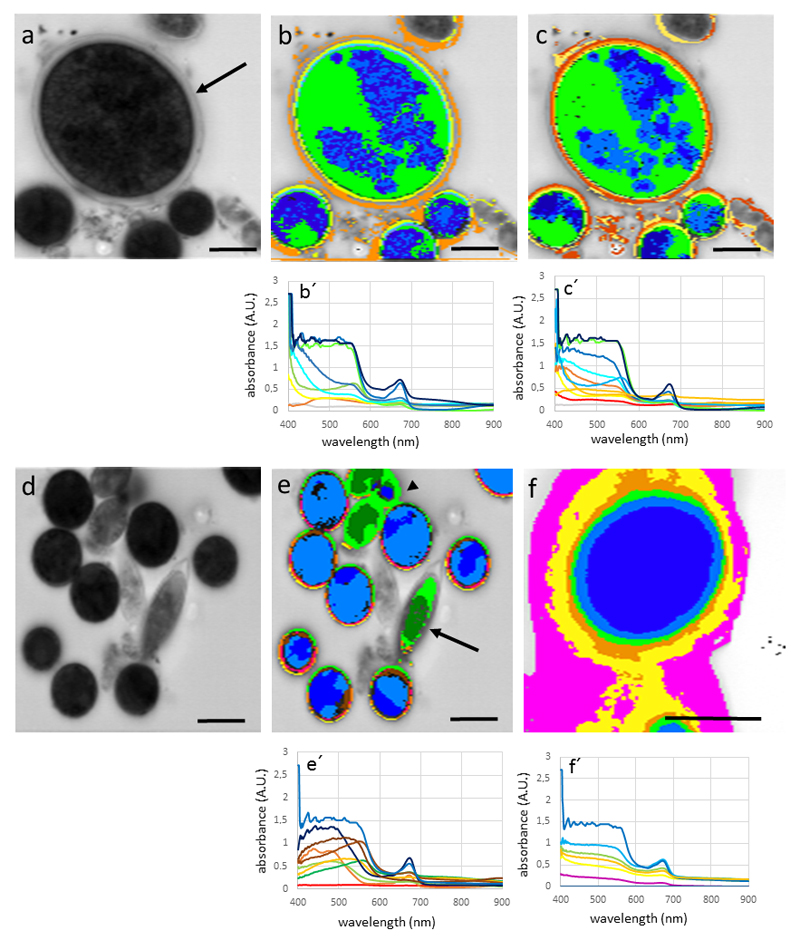
Fig. 3.
Hyperspectral images and corresponding spectra (below) of snow algae. (a) Chlainomonas sp. (arrow) and Chlamydomonas nivalis cells, bright field image, (b) hyperspectral image of the same cell with Min CC: 0.985, (c) hyperspectral image calculated with Min CC: 0.99, (d) bright field image of field sample (WP97) containing Chlamydomonas nivalis and Chloromonas brevispina (arrowhead) and Chloromonas rosae var. psychrophila (arrowhead), note the different spectral properties of the latter two, (f) Chlamydomonas nivalis from sampling site (S1). Bars 10 µm

