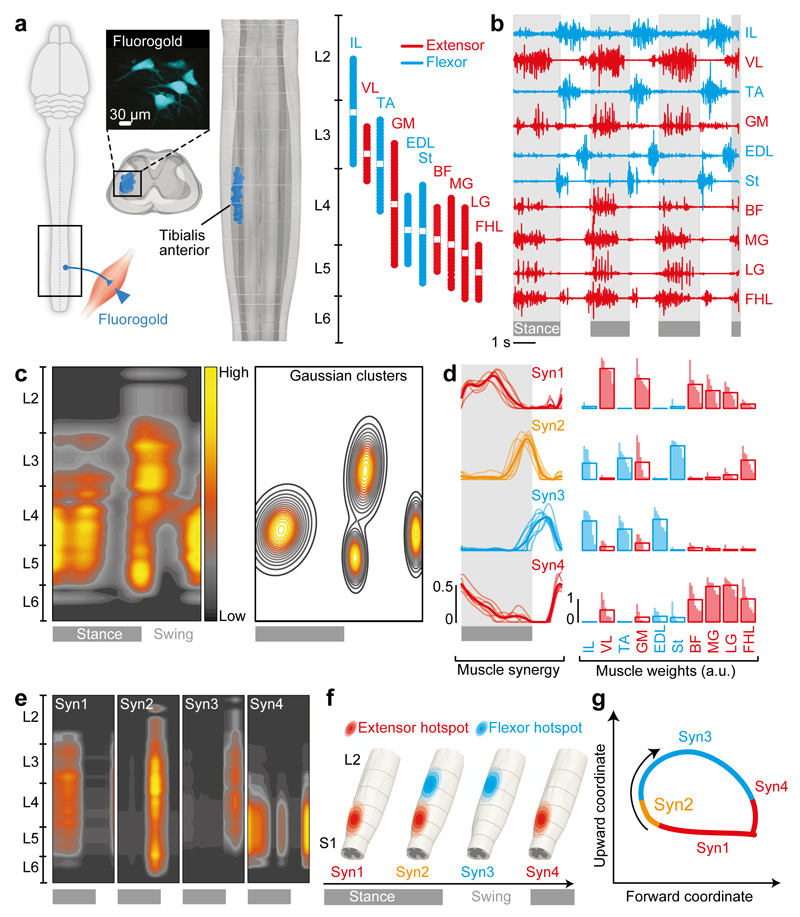
Figure 1. Spatiotemporal activation of hindlimb motoneuron during locomotion.
(a) Diagram illustrating tracer injections into the tibialis anterior (TA) muscle to label motoneurons. Top–down and coronal snapshots of 3D lumbosacral reconstructions; each TA motoneuron is represented by a single dot. The same procedure was applied to gluteus medius (GM), illiopsoas (IL), vastus lateralis (VL), semi–tendinosus (St), biceps femoris (BF), gastrocnemius medialis (MG), gastrocnemius lateralis (LG), extensor digitorum longus (EDL), and flexor hallucis longus (FHL) muscles. The rostrocaudal location and center (white square) of each reconstructed motoneuron column is indicated in red and blue for muscles acting functionally for extension versus flexion, respectively. (b) Muscle activity during locomotion in an intact rat. (c) The muscle activity was projected onto the motoneuron location matrix to elaborate the spatiotemporal map of motoneuron activation. The spatially restricted hotspots emerging during gait were extracted by applying a Gaussian cluster algorithm onto the map. (d) Mean (thick lines) and individual (thin lines, n = 7 rats) temporal activation profiles of muscle synergies (Syn 1–4), and histogram plots reporting muscle weighting for each rat (vertical bars) and muscle on each muscle synergy. (e) Spatiotemporal maps of muscle synergy activation, elaborated by representing the temporal activation profiles onto the weighted motoneuron matrix. (f) Model of spinal segments depicting the temporal sequence underlying the recruitment of muscle synergies, and the corresponding activation of extensor and flexor hotspots. (g) Illustration of the timing underlying muscle synergy activation, as captured in the spatiotemporal trajectory of the hindlimb endpoint.

