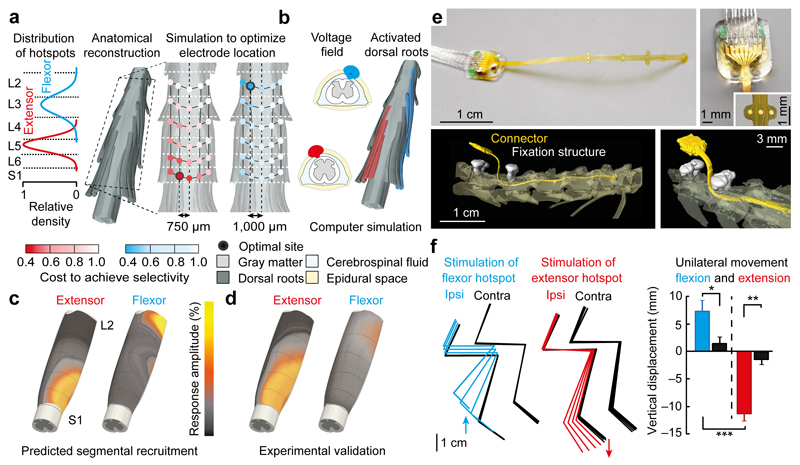
Figure 2. Design, fabrication and validation of spatially selective spinal implants.
(a) An optimization algorithm identified the cost to preferentially activate dorsal roots projecting to extensor versus flexor hotspots. The Gaussian curves display the spatial distribution of each hotspot. The dorsal roots were reconstructed in 3D (n = 3 rats). Computer simulations were iterated over a grid of electrodes covering the targeted neural structures. The black circles indicate the optimal locations of electrodes. (b) Computer simulations showing isopotential 1 V surface following a 150 μA stimulation at each identified electrode location, including the resulting dorsal root activation. (c) Spatial maps of spinal segment activation for the optimal electrodes predicted by computer simulations and (d) experimental validation in anesthetized rats (n = 4). The map is computed from motor responses recorded from eight hindlimb muscles, as described previously (Fig. 1). (e) Photographs, including zooms on electrodes and connector, showing spinal implants. The 3D rendering was reconstructed from high–resolution micro–computed tomography (μCT) scans performed after 5 weeks of implantation. (f) Under suspended conditions, a series of four bursts (40 Hz) was delivered through the electrodes targeting each hotpot. The resulting stick diagram decomposition of hindlimb movements is shown for the ipsilateral (color) and contralateral (black) side to the stimulation, together with histogram plots reporting the vertical displacement of the hindlimb endpoint (ANOVA one–way, n = 6, mean and SEM. *, P < 0.05; **, P < 0.01; ***, P < 0.001)

