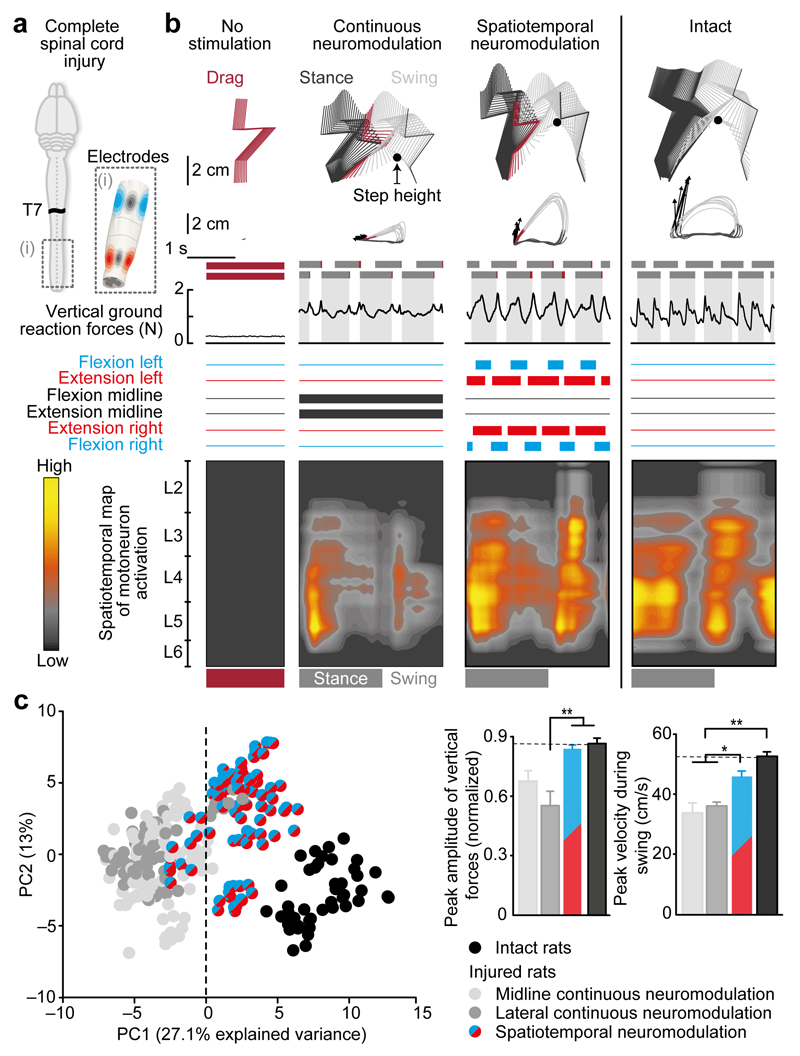
Figure 4. Spatiotemporal neuromodulation reproduces the natural pattern of motoneuron activation.
(a) Rats receive a complete SCI at the thoracic level (T8) and a spinal implant with conventional midline electrodes (black) and spatially selective lateral electrodes (blue and red). (b) Locomotion was recorded on a treadmill without stimulation, with continuous neuromodulation applied over the midline of lumbar and sacral segments, and during spatiotemporal neuromodulation. For each condition (same rat, n = 5) and intact rats (n = 3), a stick diagram decomposition of left hindlimb movement is shown together with successive trajectories of the hindlimb endpoint, the velocity and orientation of the foot trajectory at toe off (vector with arrowheads), the stance (dark gray), drag (dark red) and swing phases (light gray) of both hindlimbs, and vertical ground reaction forces during a continuous sequence of steps. The horizontal bars (blue, red, black) indicate the current state of the electrodes. The corresponding spatiotemporal maps of motoneuron activation were calculated over ten consecutive steps. Conventions are the same as previously (Fig. 1). (c) Left, PC analysis applied on 137 gait parameters with all the gait cycles recorded in rats (n = 5) under the different conditions of neuromodulation are represented in a PC space. Right, histogram plots report mean peak amplitude of vertical ground reaction forces and the mean peak velocity of the foot during swing for the different neuromodulation conditions and for intact rats. (Kurskal Wallis, mean and SEM. *, P < 0.05; **, P < 0.01)

