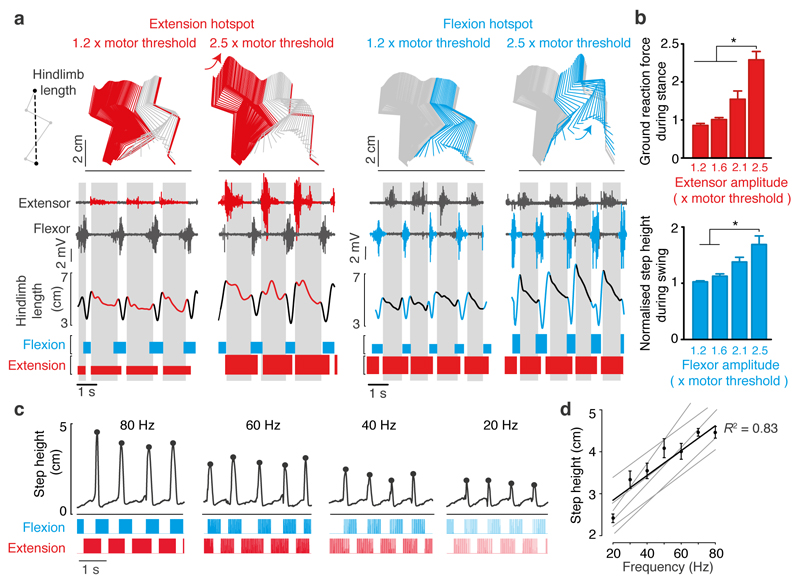
Figure 5. Selective and gradual modulation of extension and flexion components.
(a) Locomotor sequences recorded during spatiotemporal neuromodulation in an injured rat with different levels of stimulation amplitudes for the electrode targeting the extensor (left) versus flexor (right) hotspot. A representative stick diagram decomposition of hindlimb movement is shown for each condition. The colors correspond to the period during which the modulated electrode is turned on. Below, the electromyographic activity of extensor and flexor ankle muscles is displayed together with the changes in hindlimb length for a series of steps. The upper right diagram explains the calculation of the hindlimb length, which combines changes over multiple joints of the hindlimb. The spatiotemporal pattern of stimulation is shown at the bottom. The height of the bars is proportional to the stimulation amplitude. (b) Histogram plots reporting the mean vertical ground reaction forces measured during stance while modulating the amplitude of the extension electrode, and the mean step height measured during swing while modulating the flexion electrode (One–way ANOVA, n = 5, mean and SEM. *, P < 0.05.). (c) Vertical foot displacements during locomotion under different stimulation frequency adjusted over both extension and flexion electrodes. The dots highlight the step height. Each pulse of stimulation is represented in the spatiotemporal patterns of stimulation shown at the bottom. (d) The plot displays the relationships between the stimulation frequency and the step height for all the rats together and each rat individually (thin line, n = 6).

