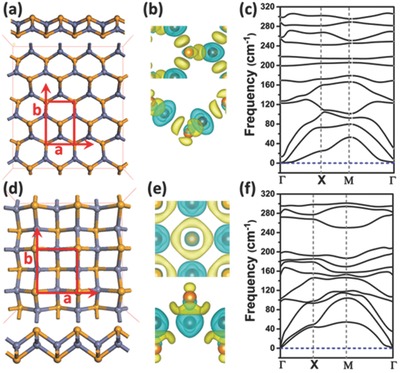
Figure 1.

a) Optimized structure, b) computed deformation charge density, and c) phonon spectrum of the ph‐ZnSe monolayer. The corresponding computation results for t‐ZnSe are displayed in panels (d–f), respectively. In panels (a) and (d), both top and side views of the optimized structure are given. The gray and orange spheres represent Zn and Se atoms, respectively. The unit cell of the ZnSe monolayer is highlighted in red. The deformation charge densities are plotted with isosurface value of 0.008 e Bohr−3, where the yellow and blue represent the electron‐rich and electron‐deficient regions, respectively.
