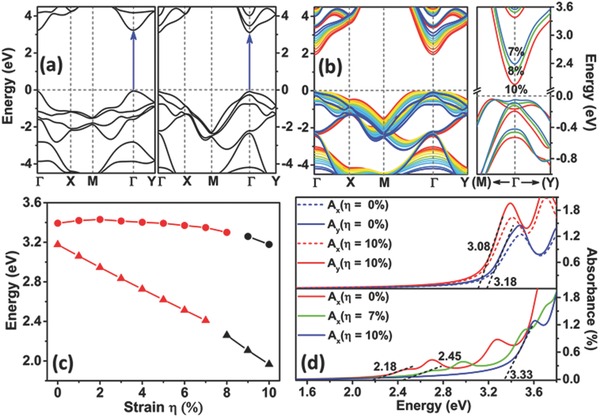
Figure 2.

a) Computed band structures of optimized ph‐ZnSe (left panel) and t‐ZnSe (right panel) monolayers. The special points Γ, X, M, and Y refer to (0.0, 0.0, 0.0), (1/2, 0.0, 0.0), (1/2, 1/2, 0.0), and (0.0, 1/2, 0.0), respectively. b) The left panel displays the band structures of the t‐ZnSe monolayer at different biaxial strain from 0% (blue line) to 10% (red line). The right panel presents the zoomed‐in band structures at 7% (light blue line), 8% (green line), and 10% (red line) strain for the t‐ZnSe monolayer near the Γ point. c) Bandgap of the ph‐ZnSe (in circle) and t‐ZnSe (in triangle) monolayers versus the biaxial strain. The direct and indirect bandgaps are distinguished by red and black colors, respectively. d) Strain‐dependent optical absorption spectra of the ph‐ZnSe (upper panel) monolayers for incident light polarized along a (x) and b (y) directions and the t‐ZnSe (lower panel) monolayers along the a (x) direction. The black dashed lines denote approximate linear fitting of the left edge of the first peak whereas the neighboring data represent estimated bandgap.
