
Figure 3.
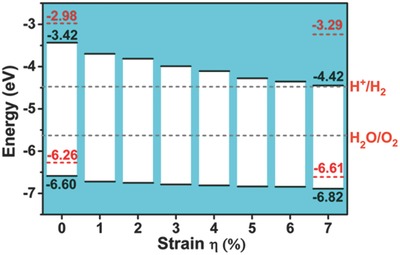
Calculated band alignment at the HSE06 level for the ph‐ZnSe (red dashed lines) and the t‐ZnSe (black lines) monolayers. The gray dashed lines represent the redox potential of water splitting reaction relative to the vacuum potential level.