
Figure 4.
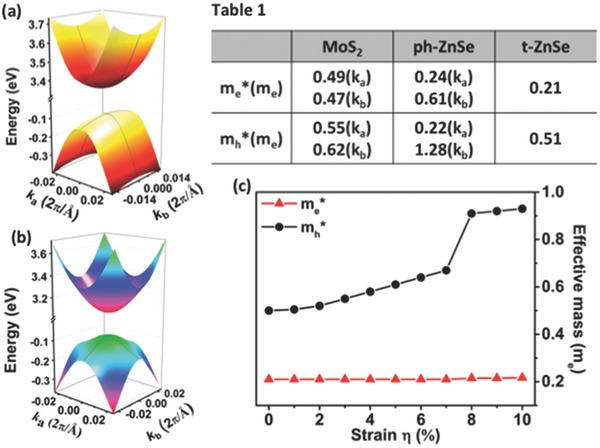
a,b) Surface plot of valleys around VBM and CBM for the ph‐ZnSe and the t‐ZnSe monolayers, respectively. Computed effective mass of electrons and holes for MoS2, ph‐ZnSe and t‐ZnSe monolayers are given in Table 1, where ka and kb refer to directions Γ → X and Γ → Y, respectively. c) Computed effective mass of electron (red triangle) and hole (black solid circle) versus the biaxial strain.