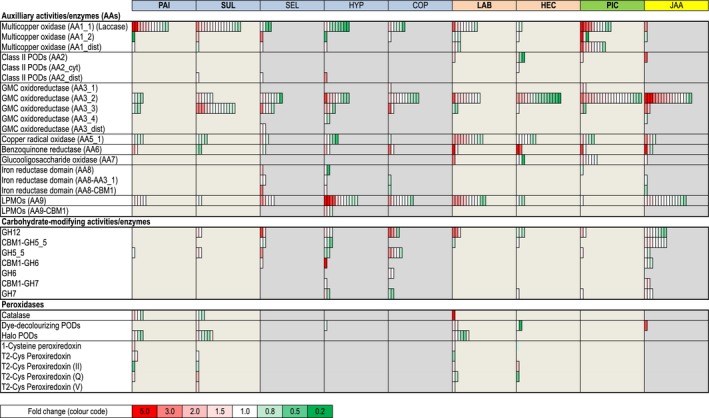
Figure 5.

Soil organic matter (SOM) regulation of selected genes encoding auxiliary redox activities/enzymes (AAs), peroxidases and carbohydrate‐modifying enzymes acting on cellulose. Shown is the average ratio of gene expression (n = 3) of pairwise comparisons in SOM extract vs modified Melin–Norkrans (MMN) medium. Within each subpanel, one for each species, the boxes represent individual gene models found within the family, and the colours show the fold change in expression. The complete sets of enzymes are shown in Supporting Information Figs S8–S10 and Tables S8–S10. The species abbreviations and clade affiliations (colour coded) are shown in the legend of Fig. 1.
