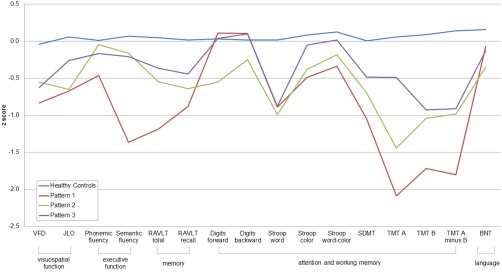
Figure 3.

Neuropsychological profile at the 3‐cluster level. Neuropsychological profiles for healthy controls in green, pattern 1 in blue, pattern 2 in red, and pattern 3 in purple. Data are presented as z scores. Lower z scores indicate worse performance. BNT, Boston Naming Test; JLO, Judgment of Line Orientation Test; RAVLT total, Rey Auditory Verbal Learning Test total; RAVLT recall, Rey Auditory Verbal Learning Test recall after 30 minutes; SDMT, Symbol Digits Modalities Test; TMTA, Trail Making Test Part A; TMTB, Trail Making Test Part B; TMTA minus B, Trail Making Test A minus B; VFD, Visual Form Discrimination Test. [Color figure can be viewed in the online issue, which is available at wileyonlinelibrary.com.]
