
Figure 1.
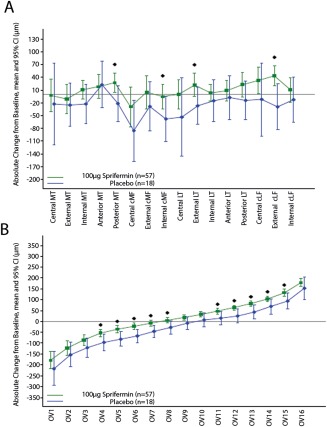
Change from baseline in subregional cartilage thickness at 12 months of followup, according to A, subregions of the cartilage and B, ordered values (OVs) of the magnitude of change in cartilage thickness (ranging from OV1, representing greatest cartilage loss, to OV16, representing greatest cartilage thickening). Significant treatment effects (unadjusted P < 0.05) were detected in 4 of 16 subregions and in 10 of 16 OVs. Bars show the mean and 95% confidence interval (95% CI). Symbols indicate individual change values that differed significantly between the 100 μg sprifermin–treated and placebo‐treated patients. MT = medial tibia; cMF = central part of the medial weight‐bearing femur; LT = lateral tibia; cLF = central part of the lateral weight‐bearing femur.