Figure 3.

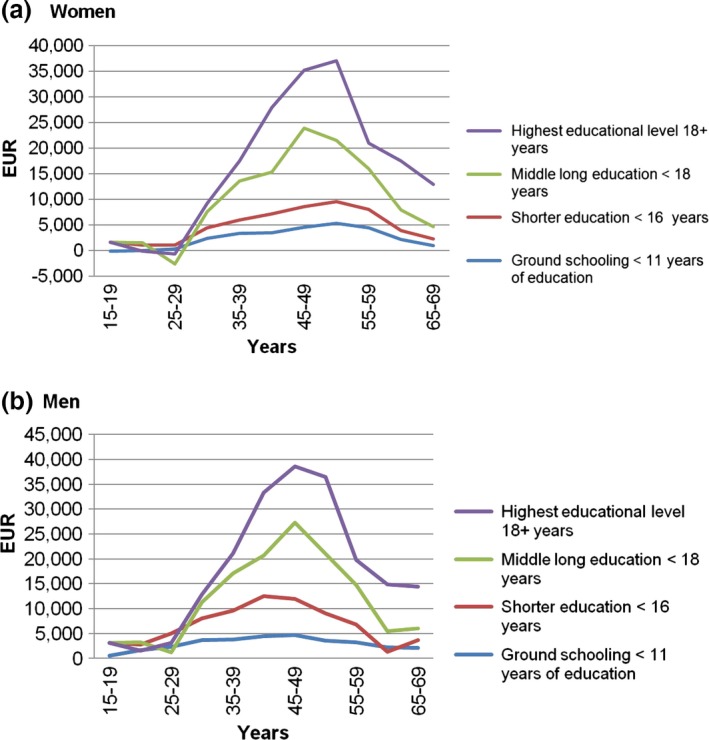
Annual difference in mean gross income according to age and education level for (a) women and (b) men with no diabetes complications.

Annual difference in mean gross income according to age and education level for (a) women and (b) men with no diabetes complications.