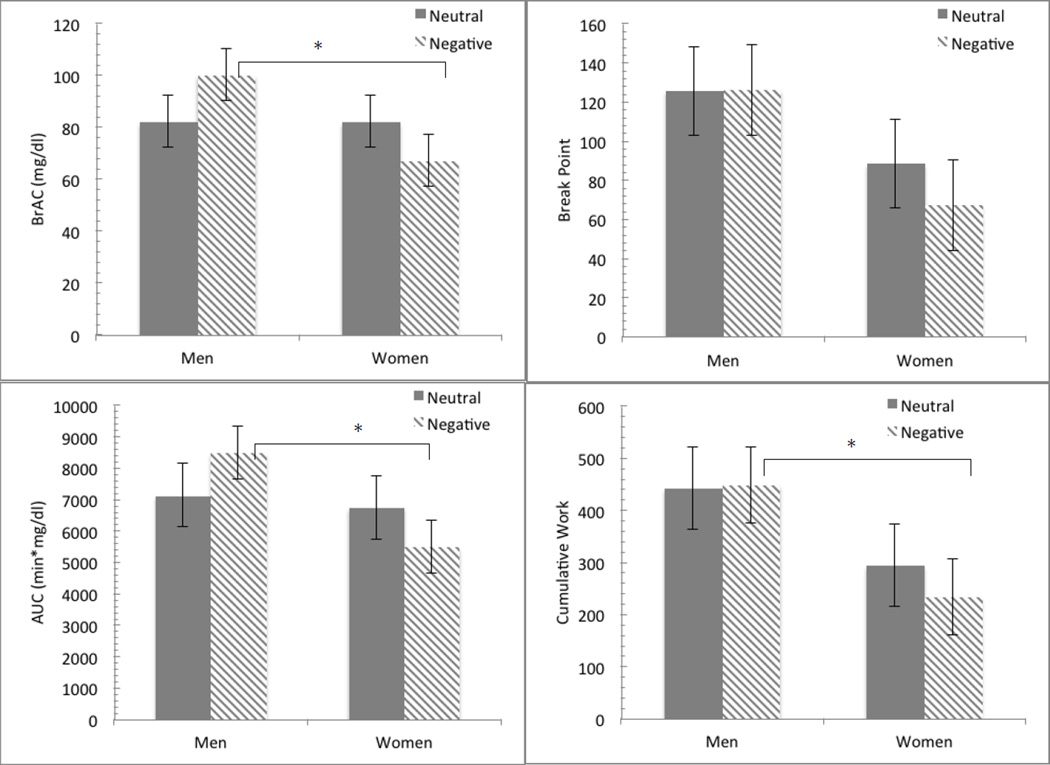
Figure 3.
Mood and gender effects on progressive work alcohol infusion. Left top panel effects on peak BrAC (mg/dl) and Left bottom panel effects on area under the curve (AUC) of the BrAC (min*mg/dl). Right top panel effects on break point and right bottom panel effects on cumulative work.
Note. *denotes followup t-test contrast significant at p<.05

