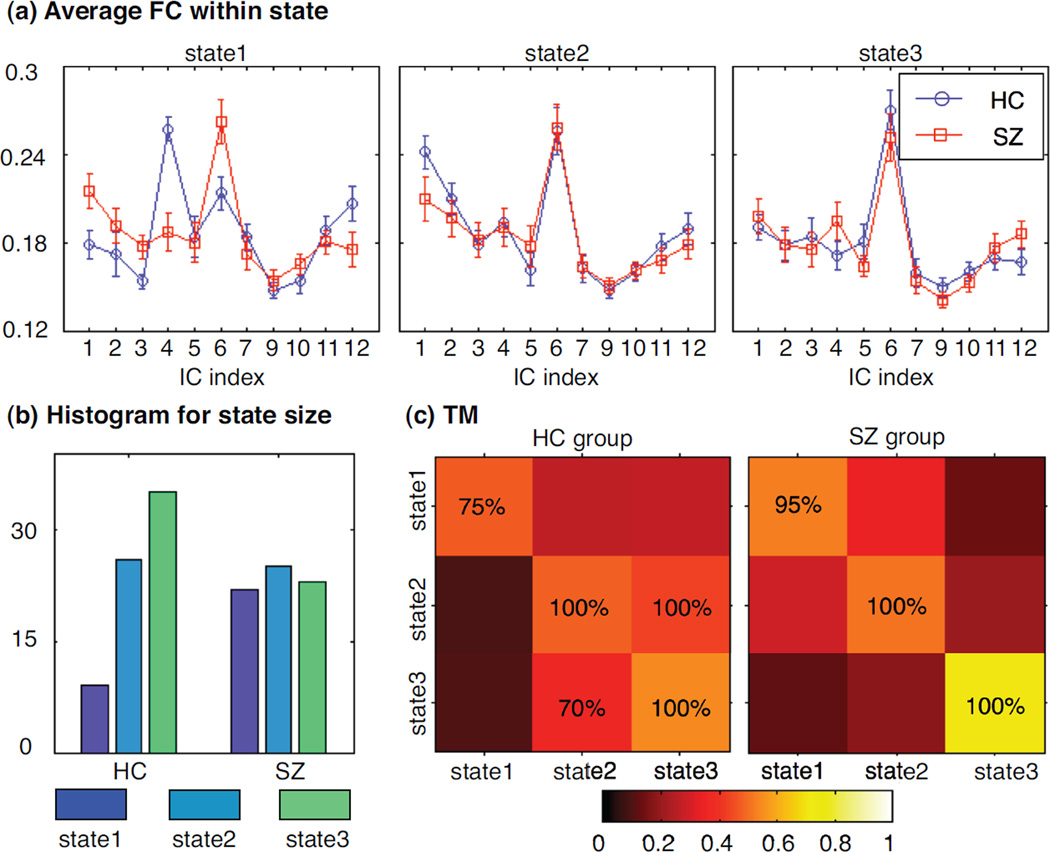
Figure 8.
One example for Markov modeling results: the connectivity between DMN component and all other 11 components, which shows more significant spatial changes over time in healthy control group: (a) average connectivity values within each state for two groups; (b) histogram for each state; (c) the transition matrix for each group, where color represents the transition probability value and the percentage value is the occurrence of significant transition probability in 20 trials of random subject selection. The number of states is determined by silhouette; for the connectivity between DMN and other components, 3 states give the best clustering solution.

