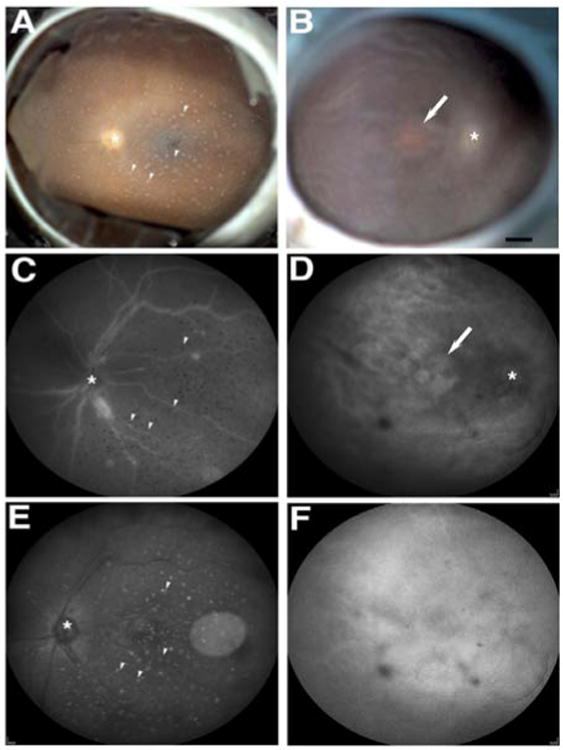
Figure 1.

Atrophic maculopathy in affected donor eye. A-B: Fundus image of affected donor (B) and age-matched control eye (A). C-D: SLO-IR imaging of affected donor (D) and matched control eye (C). E-F: SLO-AF imaging of affected donor (F) and matched control eye (E). White arrows show the atrophic maculopathy, white arrowheads show the precipitated crystals from the buffer in the fixative solution, and asterisks show optic nerve head. Bar = 0.2 cm.
