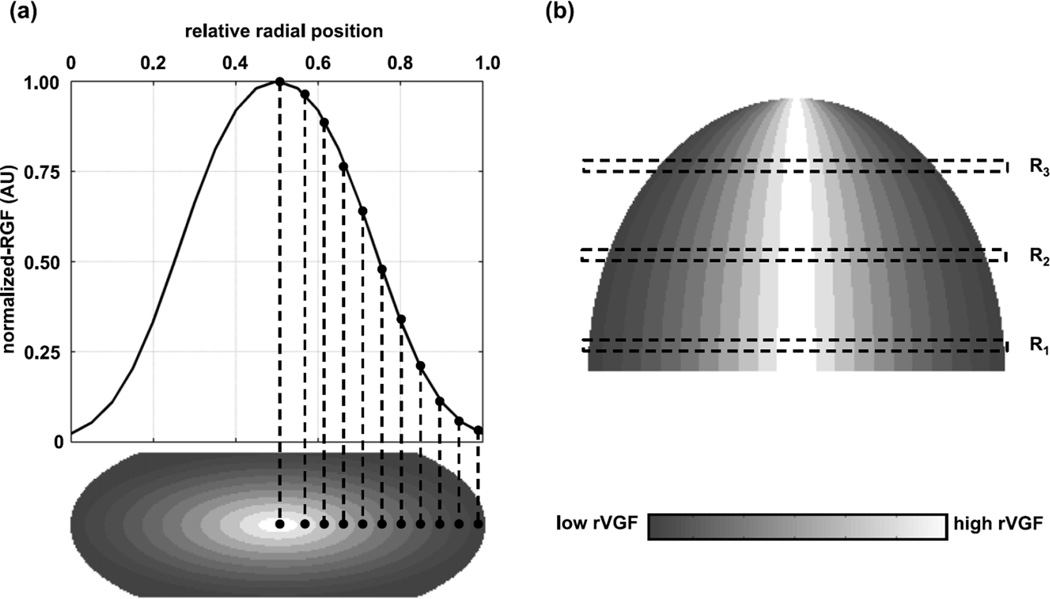
Figure 14.
Model of the glandular tissue distribution inside a new model of the breast compressed for mammography developed by Hernandez et al (2015) based on analysis of DBCT patient data. This model was used to compare the resulting MGD to that of the homogeneous model estimates. Figure from Hernandez et al (2015). Copyright (c) 2015, American Association of Physicists in Medicine (AAPM). Part (a) of the figure shows at the top the radial glandular fraction (RGF) and at the bottom in shaded form the regional volumetric glandular fraction (rVGF) in a coronal plane through the breast. Part (b) (top) shows in shaded form the rVGF in a transverse section through the breast. The scale used for shading is shown at the bottom of part (b). The reader is referred to the original paper for a detailed explanation of these quantities and how they have been used.

