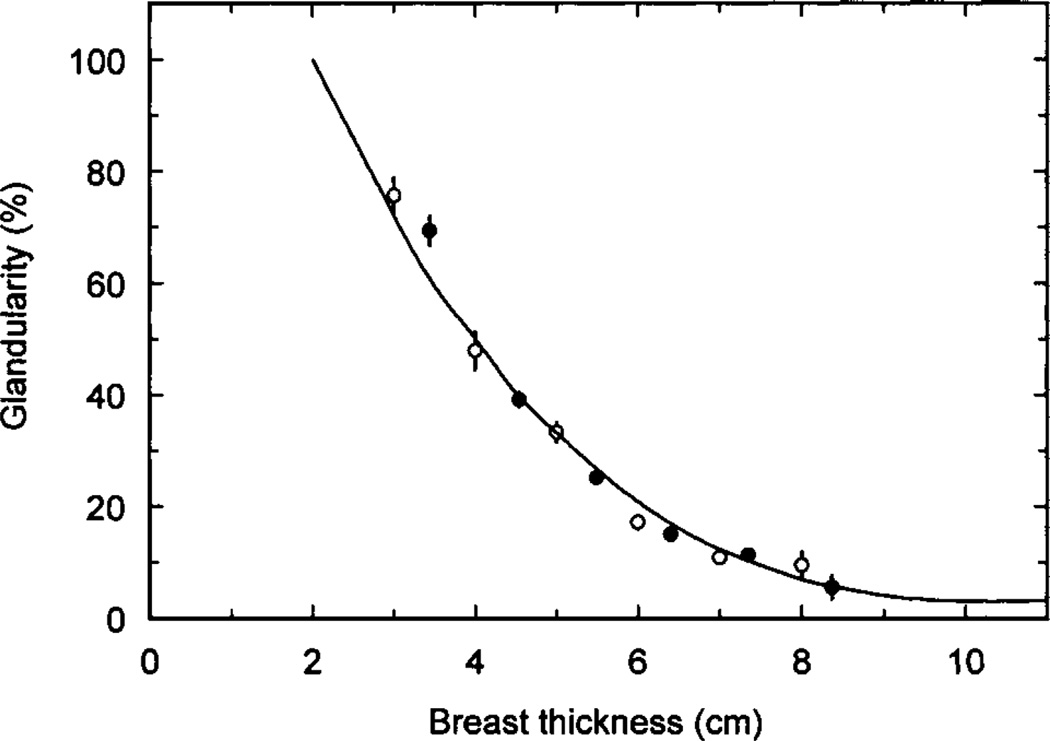
Figure 2.
Estimates of average breast composition for different compressed breast thickness from two United Kingdom centres for women in the age range 50 to 64. The error bars correspond to ±1 standard error on the mean. In some cases the error bars are too small to show. Figure from (Dance et al, 2000).

