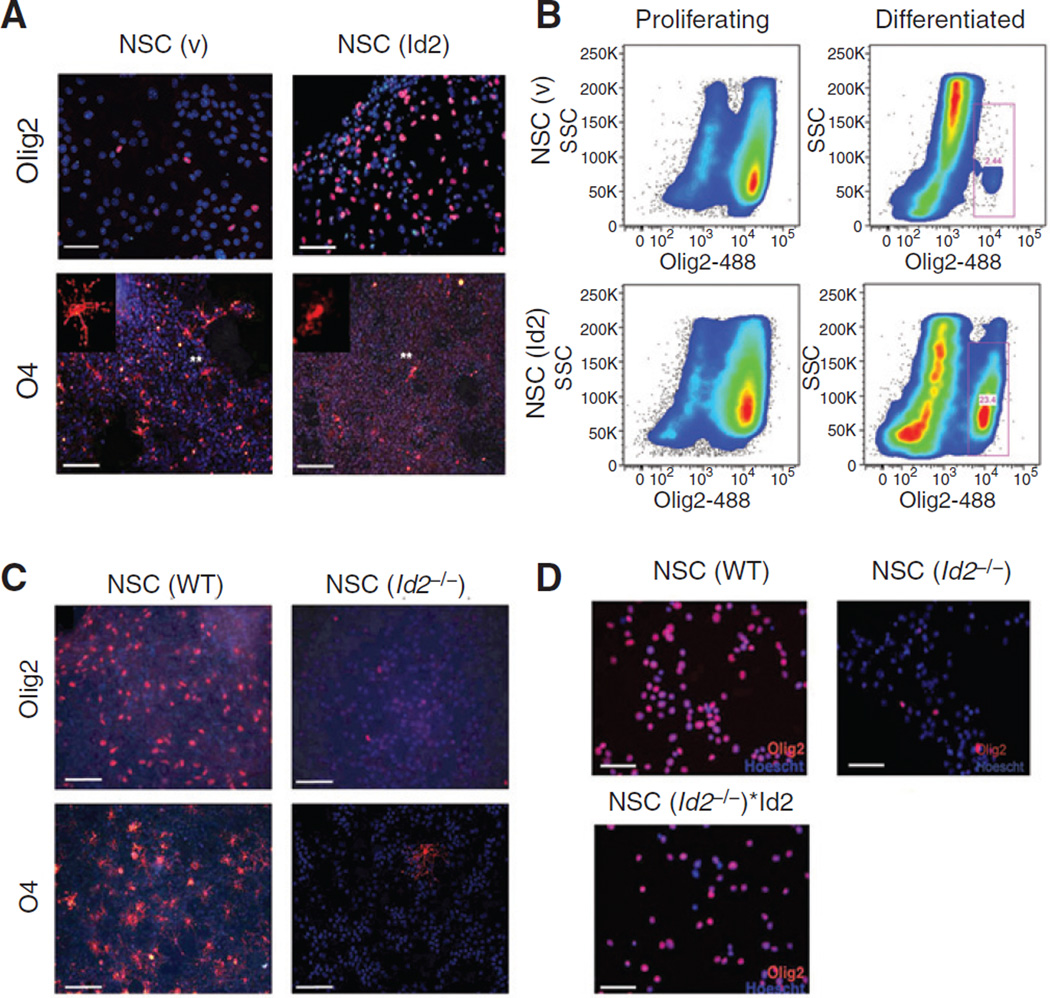
Figure 1.
Id2 expression alters oligodendrocyte differentiation. A, Olig2 and O4immunofluorescence following 7 days of serum-induced differentiation of NSC (v) or NSC (Id2). Olig2 image scale bars, 100 µm; O4 image scale bars, 200 µm. Asterisks indicate the location of cells shown at higher magnification in the inset. B, flow cytometric analysis of NSC (v) and NSC (Id2) stained with anti-Olig2 antibody conjugated to Alexa-488 fluorophore. Gated cells (red boxes) represent Olig2 (+)-expressing cells following 7 days of differentiation. C, Olig2 and O4immunofluorescence in NSC(v) and NSC (Id2−/−) 7 days after differentiation. Olig2 image scale bars, 100 µm; O4image scale bars, 200 µm. D, Olig2 immunofluorescence in NSC (v), NSCId2−/− and NSC(Id2−/−)*Id2 7 days after differentiation. Scale bars, 100 µm. Nuclei are counterstained with Hoechst dye (blue).

