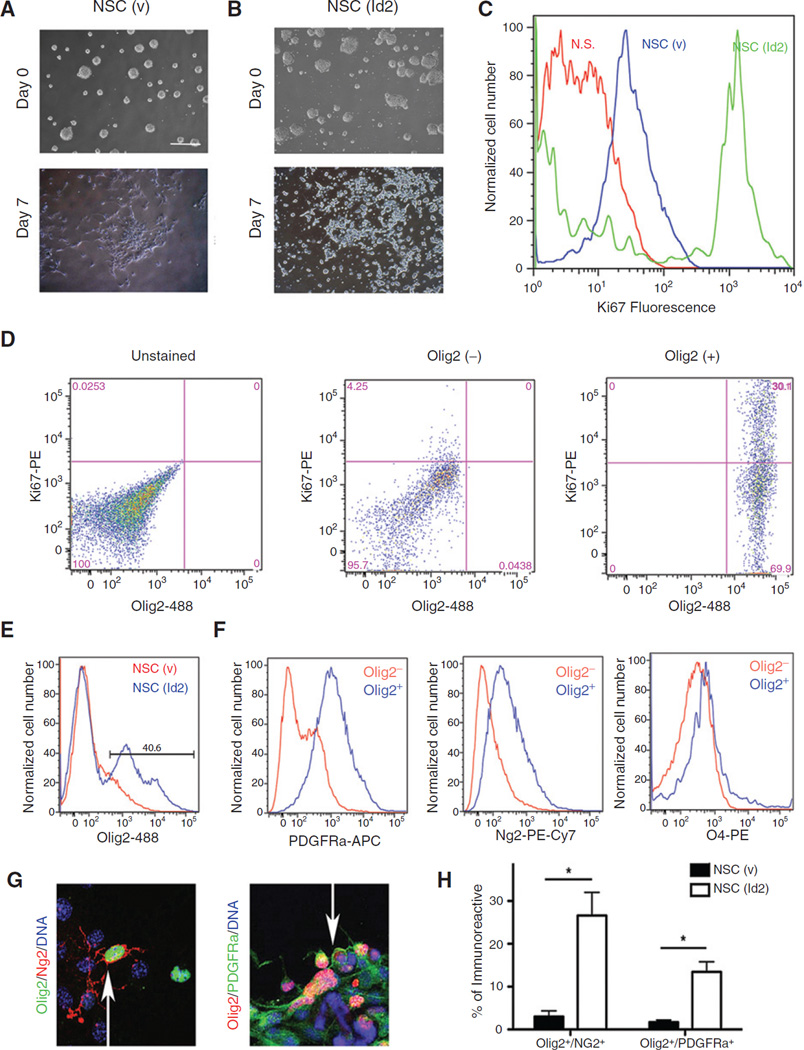
Figure 2.
Id2 expression promotes the accumulation proliferative Olig2/PDGFRa/Ng2–positive cells. A and B, NSC (v; A) and NSC (Id2; B) before and after 7 days of differentiation. C, flow cytometric histograms of NSC (v; blue) and NSC (Id2; green) following 7 days of differentiation stained for Ki67 fluorescence and compared with unstained controls (N.S., no stain, red). D, flow cytometry analysis of differentiated NSC (Id2) dual-labeled for Olig2 and Ki67. Unstained cells (left) compared with Olig2− (middle) and Olig2+ (right) populations. E and F, NSC(v) and NSC(Id2) differentiated for 7 days and analyzed by four-color flow cytometry. The Olig2+ population observed in NSC (Id2) cultures (E, gated population) was compared with the remaining Olig2− population. Individual histograms represent fluorescent labeling of PDGFRa (APC), Ng2 (PE-Cy7), and O4 (PE) in the Olig2+ (blue) and Olig2− (red) populations (F). The representative experiment shown, N = 3. G, representative images of NSC (v) and NSC (Id2) differentiated for 7 days on coated glass slides and colabeled for either Olig2 and Ng2 or Olig2 and PDGFRa. Arrows, dual-labeled cells. H, total numbers of immunofluorescent, dual-labeled cells were counted in 10 randomly selected fields following 7 days of differentiation and expressed as a percentage of total cells per field. Data represent mean double-positive cell number of two experiments conducted in triplicate. Error bars ± SD. *, P < 0.05 determined by the t test.

