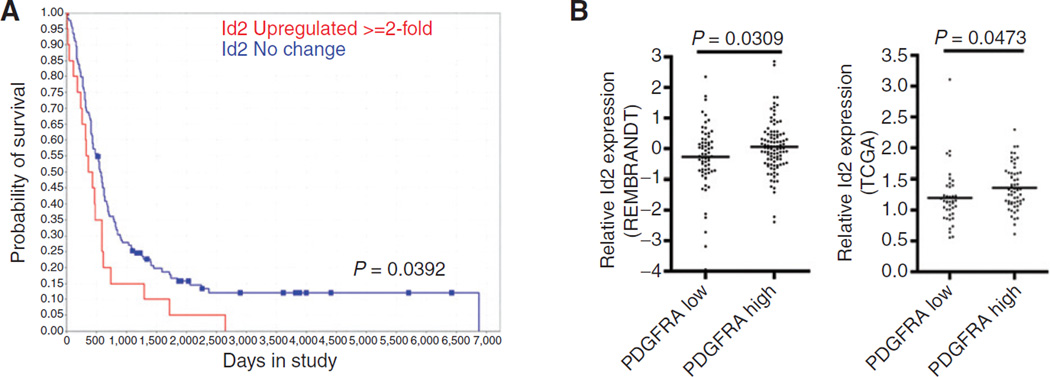
Figure 4.
Role of Id2 and PDGF in gliomagenesis. A, Kaplan–Meier analysis of patients with glioma annotated in the REMBRANDT database binned into two groups of adult patients (40 years of age) representing those with Id2 expression levels equivalent to nontumor controls and Id2 levels greater than 2-fold above nontumor controls (P = 0.0392 determined by the log-rank test). B, relative Id2 mRNA expression in tumors annotated in the Rembrandt database (left; P = 0.0473) and the TCGA glioblastoma database (right; P = 0.0309) binned into two groups, PDGFRA high (expression Z-score ≥ 1 or expression 2-fold greater than normal) and PDGFRA low (expression Z-score ≥ 1 or expression 2-fold less than normal).

