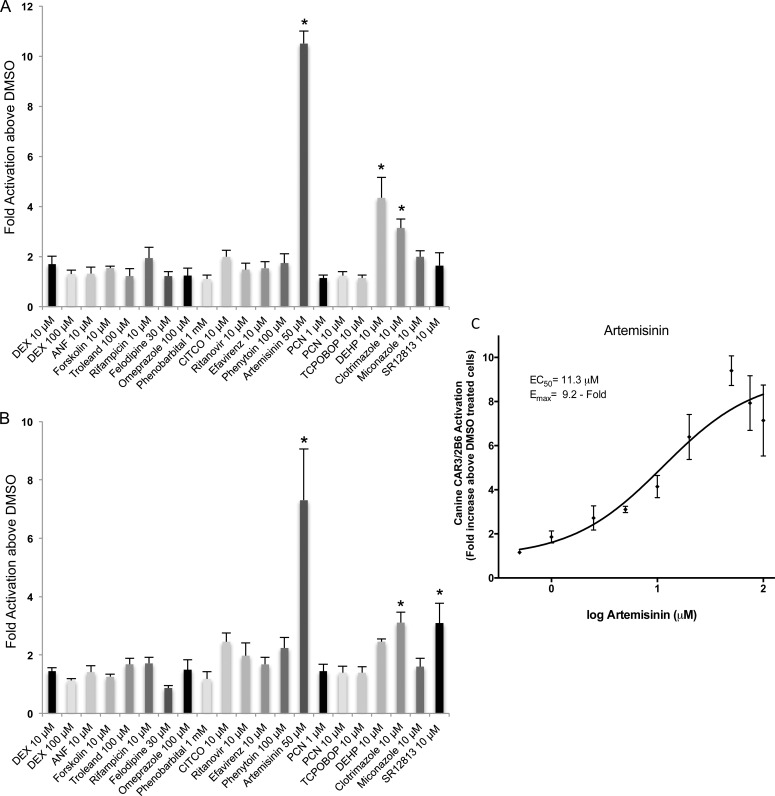
Fig 2. Transactivation of canine CAR3 by 19 different compounds.
HepG2 cells were transfected with the canine CAR3 or empty expression vector and the CYP2B6 promoter and enhancer linked to a luciferase reporter vector (A) or luciferase reporter vector with CYP3A4 proximal and distal promoter regions (B) before seeding in 96-well plates as described in Materials and Methods. Cells were treated with the panel of 19 chemicals for 48 h before detection of fluorescence for cell viability and luminescence for transcriptional activation. All luminescence values were normalized for cell viability. Data for each test compound and concentration represents the mean ± SE from three independent experiments in triplicate expressed as fold activation above vehicle control treated cells. All data is normalized against fold activation values from transactivation assays with an empty expression vector. An asterisk denotes compounds exhibiting significant difference from their respective vehicle control at a level of p < 0.01. (C) A representative artemisinin dose-response curve for the cCAR3/2B6. Cells in triplicate wells were treated with 0.5, 1, 2.5, 5, 10, 20, 50, 75 and 100 μM artemisinin for 48 h before luminescence was detected and normalized against cell viability (fluorescence values). Results are expressed as fold activation above 0.1% DMSO treated cells. Data represents the mean ± SE from three independent experiments in triplicate. EC50 and EMAX values were calculated using nonlinear regression of a typical log dose-response curve.

