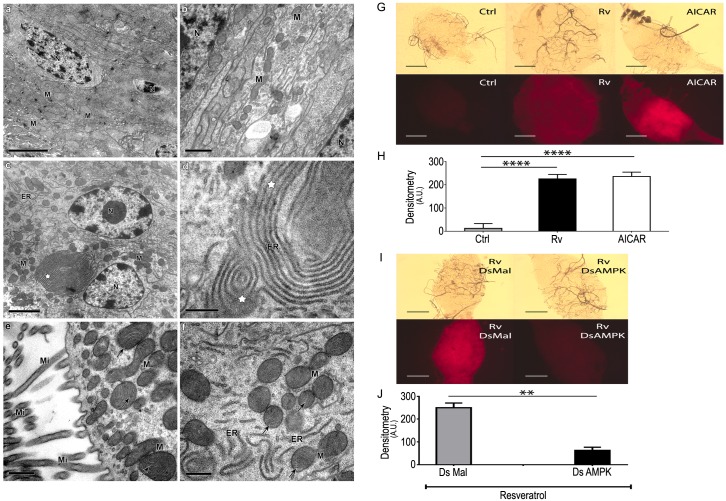
Fig 5. Rv triggers autophagy in mosquito midgut.
(A, B) Typical ultrastructural appearance of mosquito midgut fed on a control diet. (C-F) Midguts from insects fed on Rv. White stars indicate the formation of concentric membrane structures. Black arrows indicate preserved mitochondrial morphology and normal cristae aspects. N: nucleus; M: mitochondria; Mi: microvilli. Bars in panels A and C: 2 μm. Bars in panels B, D-F: 0.5 μm. (G) Midgut images obtained under a fluorescence microscope after incubation with LysoTracker Red (upper panels, DIC) (lower panels, fluorescence). (H) Densitometry of LysoTracker fluorescence images shown in panel G. (I) Images obtained as in panel G following the silencing of mosquito AMPK (DsAMPK) or an unrelated protein (DsMal). Insects were kept on the indicated Control (Ctrl), Rv or AICAR diets. (J) Densitometry of LysoTracker fluorescence images shown in the lower part of panels I. Rv—100 μM Rv; AICAR—1 mM AICAR. **—p<0.01; ****—p<0.0001 as calculated by one-way ANOVA with Tukey post test (I) and by Student’s t-test (J). Data in panels I, J represent means and s. e. m. (n = 3).

