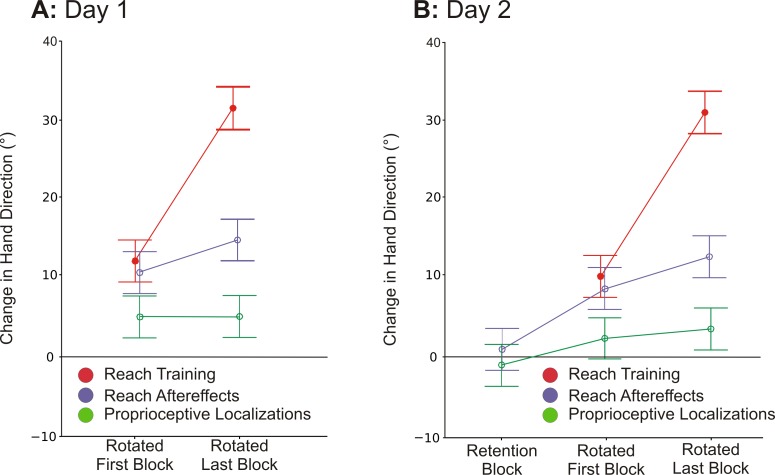
Fig 4.
Mean changes in hand location at peak velocity and at reach endpoint for each respective task as in Fig 3, for the first and final block of training in Day 1 (A) and in Day 2 (B), relative to aligned-training baseline. Error bars represent +/- 1 standard deviation from the average. The line at zero represents baseline performance.

