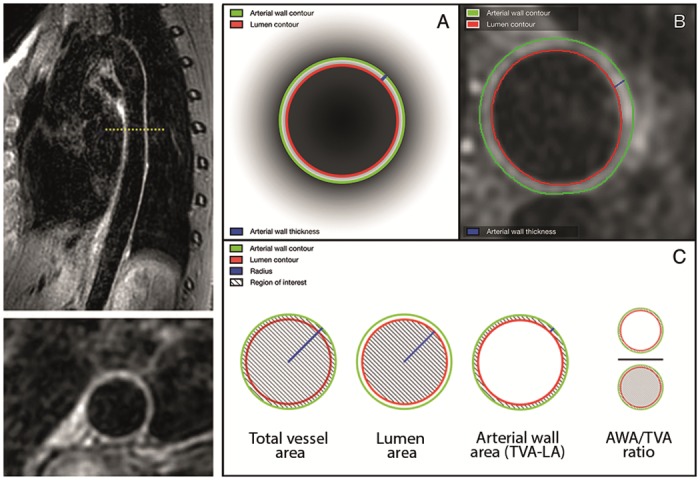
Fig 1. Example of 3D-T1-BB-VISTA acquisition and quantification of aortic wall characteristics.

Left images: example of sagittal and reconstructed transversal images of the descending thoracic aorta obtained with the 3D-T1-BB-VISTA sequence in a 32-year-old female participant. Right images: graphic illustration of quantification of descending thoracic aortic wall characteristics. A and B are a graphic and in vivo representation of contour tracing and thickness measurements, respectively. C is a schematic illustration of the quantification methods for the various studied aortic wall characteristics.
