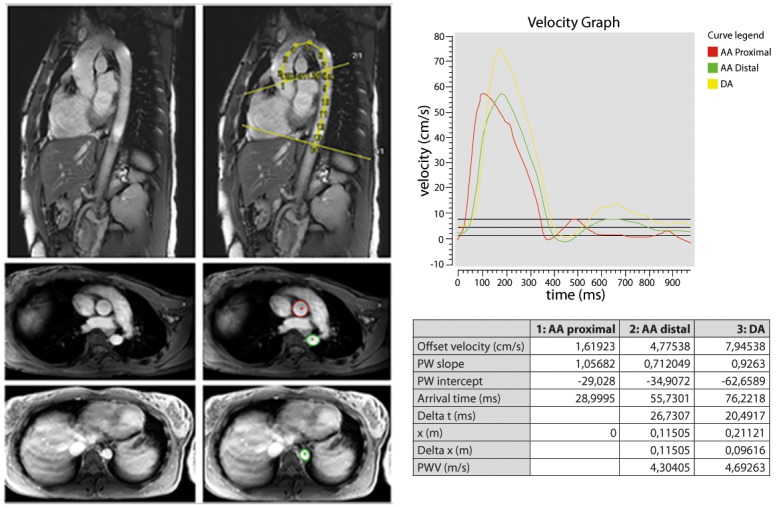
Fig 3. Example of double oblique candy cane and through-plane images and quantification of PWV parameters.

Upper left images: example of plain and traced candy cane images in 32-year-old female participant. The aortic centreline was traced to measure aortic distances. Middle/lower left images: example of plain and traced through-plane images. Contours were traced in the ascending (pulmonary trunk) and proximal descending aorta and near the dome of the liver for aortic velocity mapping. Right image: illustration of velocity graph. Proximal, descending and total thoracic aortic PWV were quantified via linear modelling.
