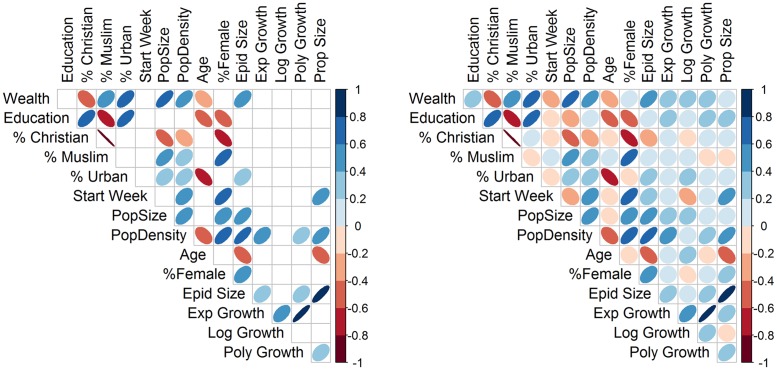
Fig 4. Pairwise Spearman correlation plots between outcomes and covariates.
The direction of correlation is indicated by color type (blue: positive; red: negative). The strength of correlation is indicated by color intensity; uncertainty around the estimates is indicated by width of the ovals (wider: more uncertainty). A. Only correlations statistically significant at α = 0.05. B. All correlations. Outcomes: regional growth rate estimated using data from first 15 weeks of epidemic in each region (exponential fit, “ExpGowth”; logistic fit, “LogGrowth”; polynomial fit, “PolyGrowth”); total number of infections reported in each region (“EpidSize”), proportion of whole population infected (“EpidProp”). Socio-economic covariates: wealth index, “Wealth”; average years of education, “Education”; percent of population Christian, “%Christian”; percent of population Muslim, “%Muslim”; percent of population living in urban area, “%Urban”; number of weeks from start of EVD in West Africa to the first recorded case in each region, “StartWeek”; population size, “PopSize”; population density, “PopDensity”; average age, “Age”; percent of population female, “%Female”).

