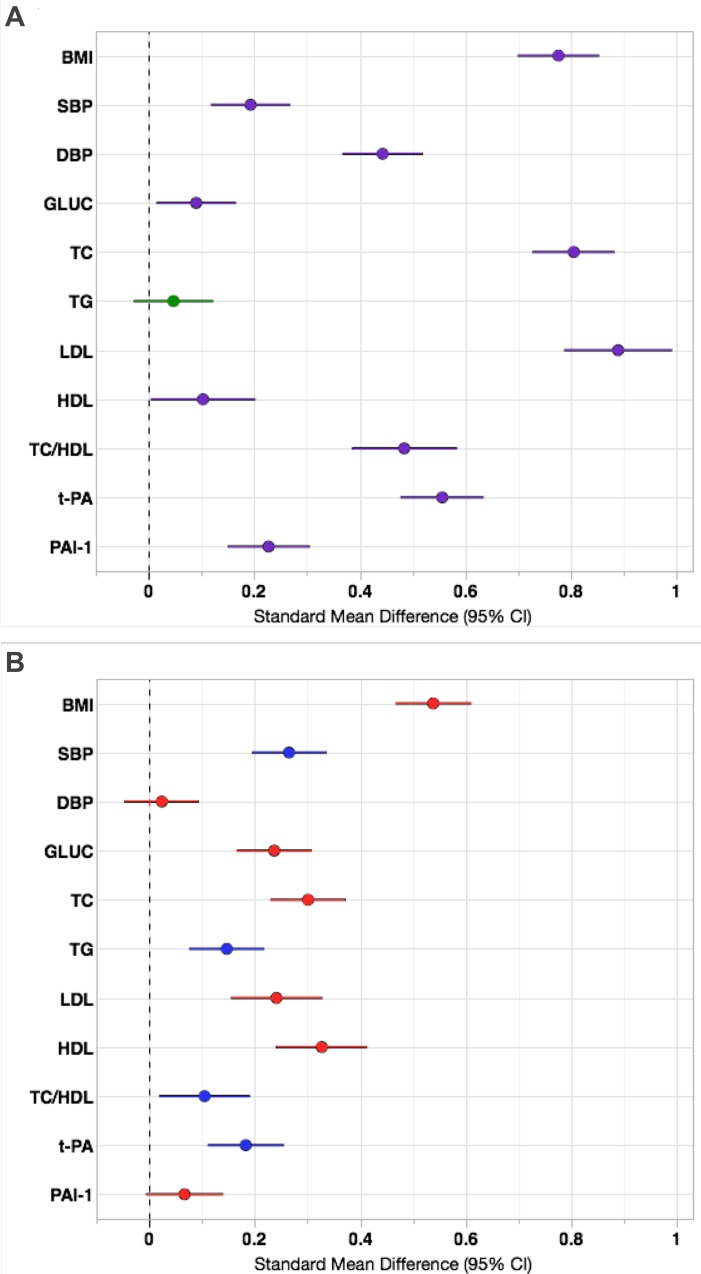
Fig 2. Effect sizes of urban/rural environment and sex on continuous cardiovascular risk factors in Brong Ahafo, Ghana.
(A) Absolute differences between urban and rural standardized means (with 95% confidence intervals); purple lines indicate that the urban group has a higher mean and green lines indicate that the rural group has a higher mean. Data were adjusted for age and sex. (B) Absolute differences between male and female standardized means (with 95% confidence intervals); red lines indicate that the females have a higher mean and blue lines indicate that males have a higher mean. Data were adjusted for age and urban/rural residence. Abbreviations as described in methods.

