
Figure 5.
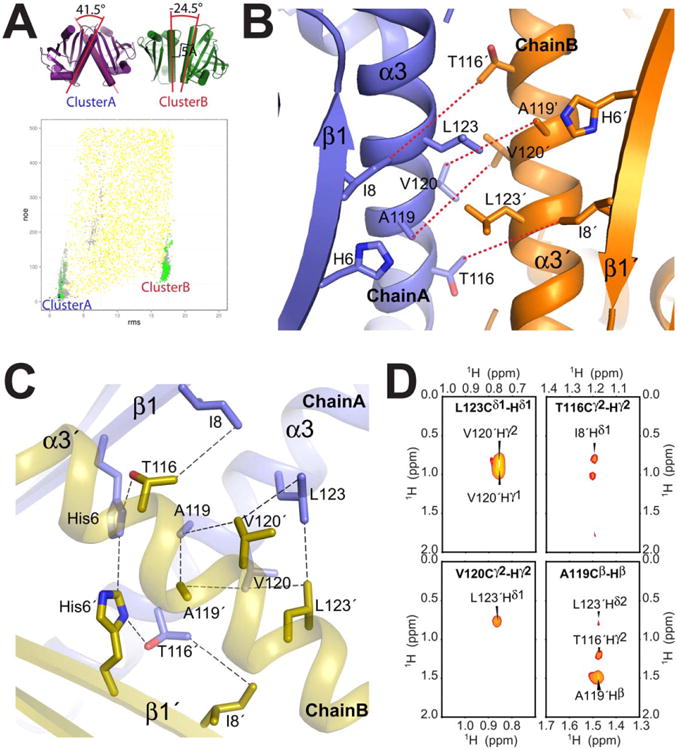
Validation using an independent set of interchain NOEs. A) Agreement of double half-filtered intermolecular NOEs (not used as structure restraints in Phase I/II calculations or filtering steps shown in Figure 2) vs. RMSD to the lowest-energy structure. For clarity, only models with below 500 NOE penalty score (using a flat-bottom scoring term with a 5.5Å upper limit and an exponential penalty function) are shown. Color scheme is the same as in Figure 3: Phase I/global docking (yellow), Phase II/local perturbation (grey), below post-Phase II filter (green) and lowest 10 ΔΔG scores (final structures, blue). two most prominent clusters of filtered models (“Cluster A”, “Cluster B”) are indicated, and their differences in terms of the dimer orientation are highlighted on the lowest-energy representative structural models on the top left. B) Lowest-energy representative structure from cluster B shows a number of intermolecular NOE violations, between Ile8, Thr116, Ala119 and V120, as indicated by red dashed lines. C) Close up view of the dimer interface in the final model from Cluster A (1st member of the final ensemble). Dashed lines indicate the intermolecular contacts identified in the NMR spectra (3D double half-filtered 13C-edited NOESY in black, 3D-13C-edited NOESY in green). D) Assigned X-filtered NOESY cross-peaks used to validate the Aha1 structure. In bold is the assignment of the 13C labeled direct observed 1H atom and label on the peak is the interchain 12C labeled 1H. Further interchain cross-peaks were assigned in the 3D NOESY spectra that connect T116 Hγ2 to His6 Hα unambiguously (Supporting Information Table S3).