
Figure 6.
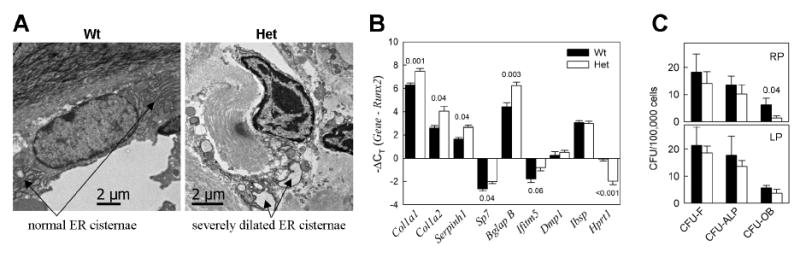
Osteoblast cell stress. A. Electron microscopy images of lumbar vertebrae osteoblasts in RP diet animals, illustrating severe ER dilation in Het osteoblasts. B. qPCR analysis of gene transcription in frontal bone of Wt and Het calvaria (see Supplementary Table S4 for full statistical analysis). Since no systematic differences between gene transcription in RP and LP animals were observed (Supplementary Fig. S5), the animals from both diet groups were pooled together (in each genotype, N=4 for Col1a2 and Serpinh1and N=10 for all other genes). C. Differentiation of BMSCs from RP and LP animals in culture at identical conditions (3 animals in each group and 6 wells/animal in each CFU experiment were examined, see Supplementary Table S5 for statistical analysis).