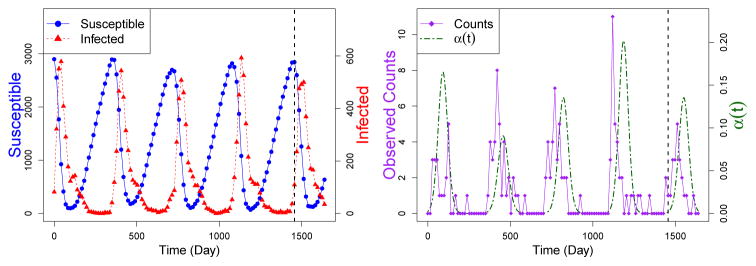
Fig 2.
Plots of simulated hidden states (counts of susceptible, St, and infected, It, individuals) and the observed data (number of observed infections = yt ~ Binomial(It, ρ)) plotted over time, t. Simulation with seasonally varying α(t) generates data with seasonal epidemic peaks. The dashed vertical black line represents the first cut off between the training sets and the test data. Data before the line are used to estimate parameters, and we use those estimates to predict the data after the line. Other data cut offs are shown in Figure 3

