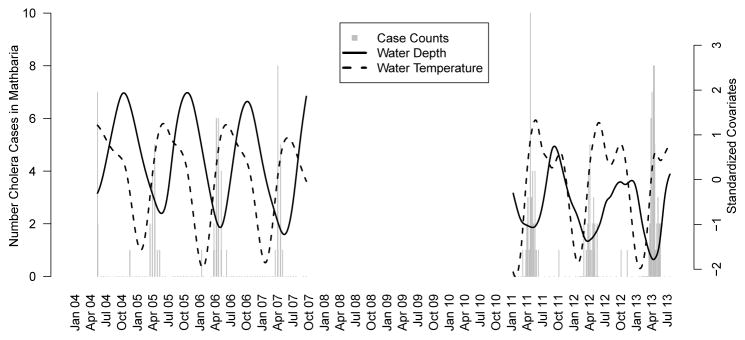
Fig 4.
Barplot of cholera case counts in Mathbaria, Bangladesh and the standardized covariate measurements over time. The covariates are shown with a lag of three weeks. No data were collected from October 2007 through November 2010. The ranges of the unstandardized smoothed covariates are 1.4 to 2.8 meters for water depth and 21.6 to 33.1°C for water temperature.

