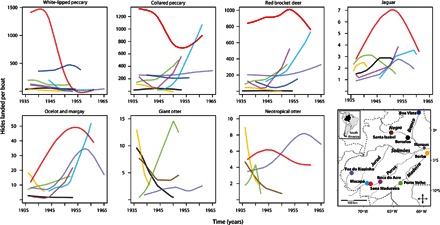
Fig. 3. Time series of animal harvests at nine localities in the central-western Brazilian Amazon.

The curves show estimated number of hides transported per boat and are color-coded according to trade locality. Data are gleaned from cargo manifests of the J. G. Araujo Company.
