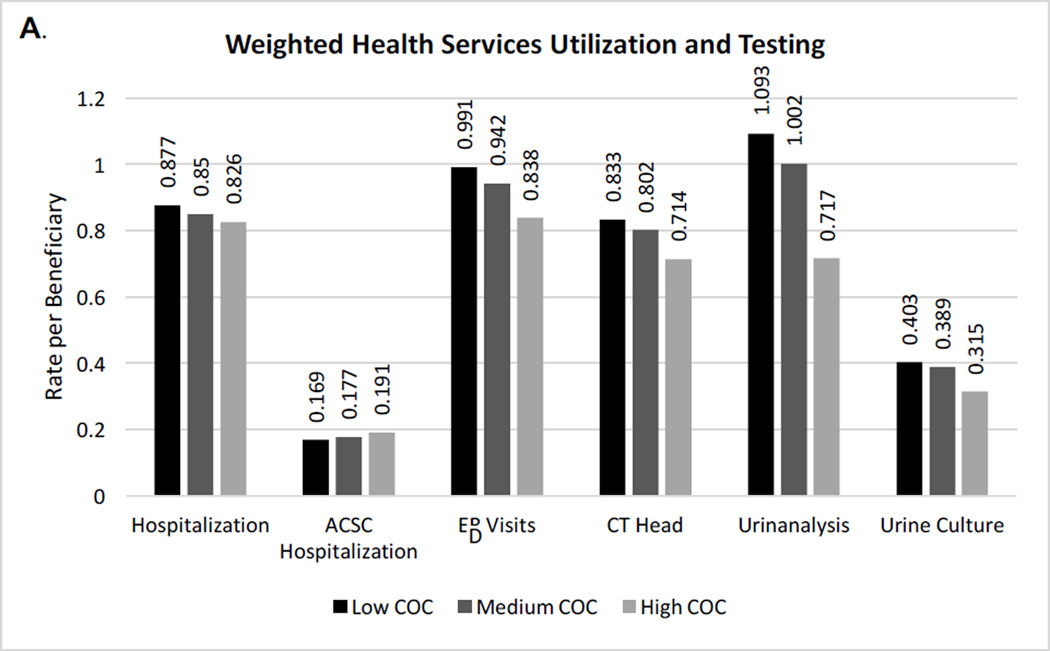
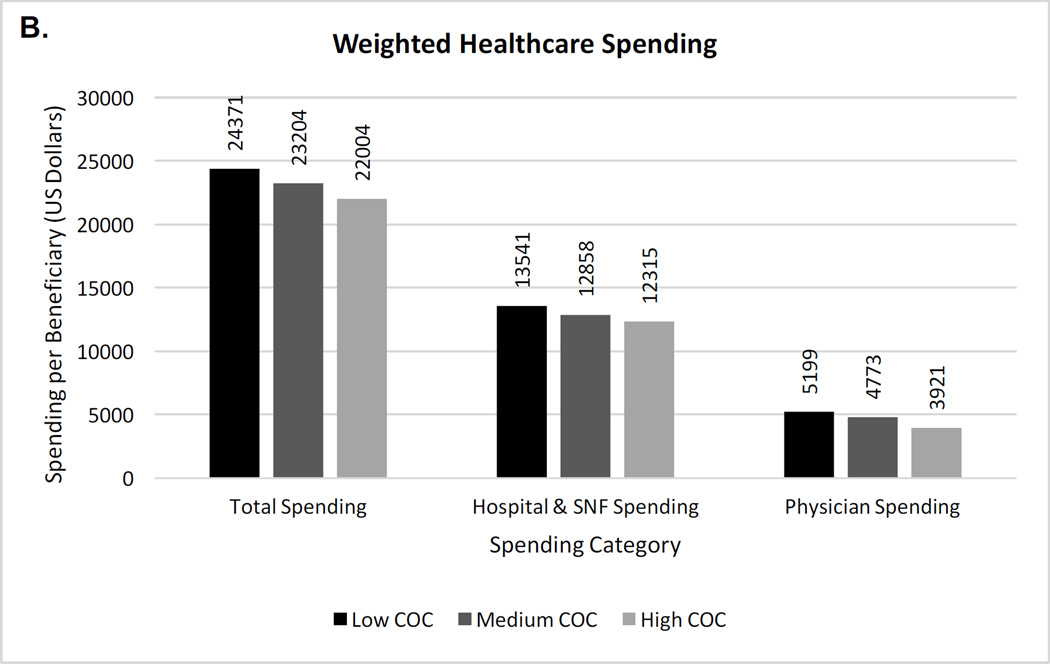
Figure 1. (A&B) Inverse probability weighted rates of health services, testing, and healthcare spending per beneficiary by continuity of care level.
Chest x-ray rates, not shown due to scale, were 2.13, 2.05, and 2.12 for low, medium, and high continuity tertiles, respectively. Differences between the three continuity of care groups for all outcomes were statistically significant (p < 0.001) using analysis of variance.
COC = continuity of care; ACSC = ambulatory care sensitive condition; ED = emergency department; CT= computed tomography; SNF = skilled nursing facility


