
Figure 4. TP53RTG copy number is correlated with body size evolution in Proboscideans.
(A) Time calibrated Bayesian phylogeny of TP53/TP53RTG genes. TP53RTG genes are shown in blue, the 95% highest posterior density (HPD) of estimated divergence dates are shown as red bars, nodes with a posterior probability (PP)(PP) > 0.95 are labeled with closed circles whereas nodes with a PP ≤ 0.95.95 are labeled with open circles. The period corresponding to the expansion of the TP53RTG gene repertoire is shown in a grey. (B) TP53/TP53RTG copy number (blue) and Proboscidean body size (red) increases through time are correlated.
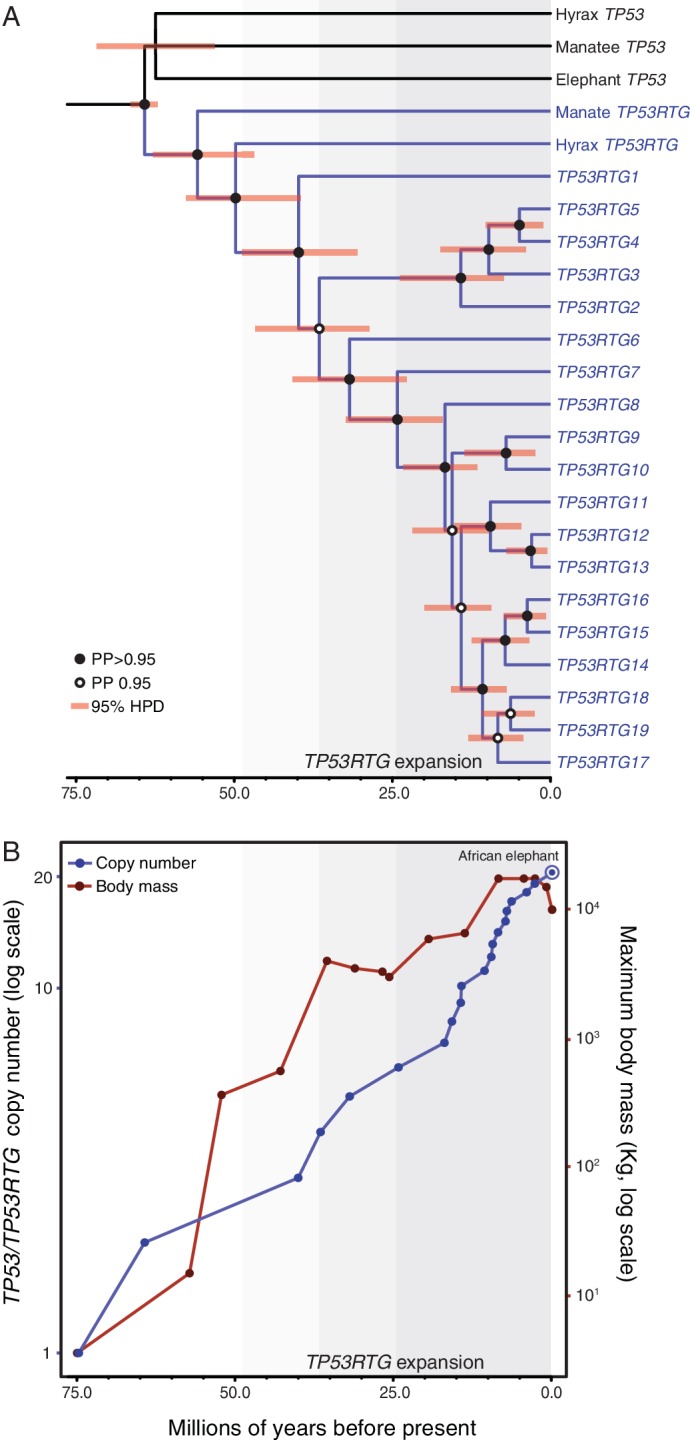
Figure 4—figure supplement 1. TP53/TP53RTG gene trees.

Maximum likelihood gene trees with aBayes, Chi-Square, aLRT, and SH-like branch supports. Bayesian tree inferred by MrBayes. Numbers along branches indicate node supports from each method. Note that the full dataset included 65 diverse species and only the Paeunngulate clade is shown. TP53 gene trees were inferred using a general time reversible model (GTR), empirical nucleotide frequencies (+F), a proportion of invariable sites estimated from the data (+I), four gamma distributed rate categories (+G), and using the best of NNI and SPR branch moves during the topology search (for the maximum likelihood tree).