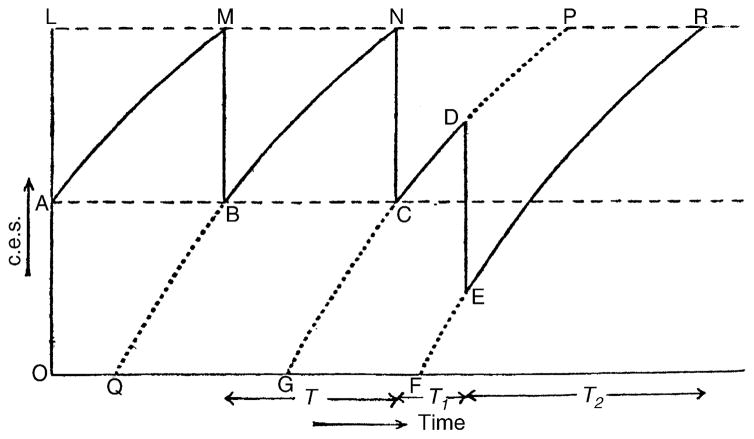
Fig. 1.
A reproduction of Fig. 35 in Eccles and Hoff (1932). The original figure legend read: “Schematic representation of rhythmic discharge and the action of a single antidromic impulse” (p. 507). The associated text read: “The production of a rhythmic reflex discharge according to the conditions postulated is illustrated in Fig. 35, where intensities of c.e.s. are plotted as ordinates against time as absicssae. OF is the line of zero intensity of c.e.s. According to the fourth assumption the intensity of c.e.s., OA, at the point A just after a reflex discharge, equals half the threshold intensity OL. As a result of its uniform production and spontaneous subsidence, c.e.s. is represented as increasing in intensity during normal rhythm along the line AM to again attain threshold at M, where the next reflex discharge is set up. The intensity of c.e.s. falls from M to B, and then increases along the line BN, till at N another reflex discharge is set up, with a consequent fall of c.e.s. to C followed by an increase to P, and so on. By assumption an antidromic impulse acting at a point D, Fig. 35, inactivates an intensity. . . of c.e.s., as shown by the line DE, and c.e.s. then increases along the line ER to regain a threshold intensity at R, where a reflex discharge is set up” (pp. 507–509). The text also provided a mathematical description of these relations and a derivation of the relationship between T2 and T1. Reprinted with permission of the publisher.

