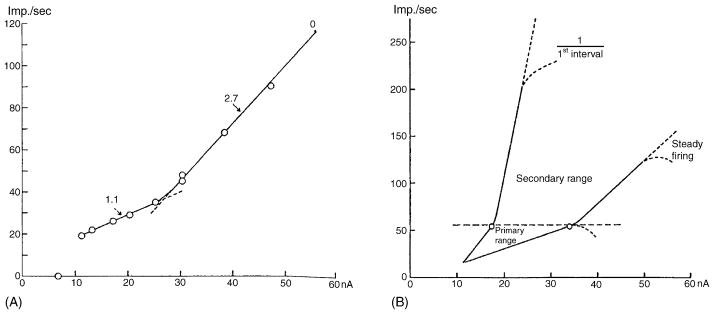
Fig. 3.
A reproduction of Figs. 2 and 8 in Kernell (1965b) demonstrating primary and secondary range firing in a cat motoneuron. The plot in his Fig. 2 is of steady-state firing frequency vs. injected current, and the numbers are the slopes of the primary and secondary range of firing in Hz/nA. His Fig. 8 is a schematic f–I graph demonstrating the primary and secondary ranges for first interval vs. steady-state firing. Reprinted with permission of the publisher.

