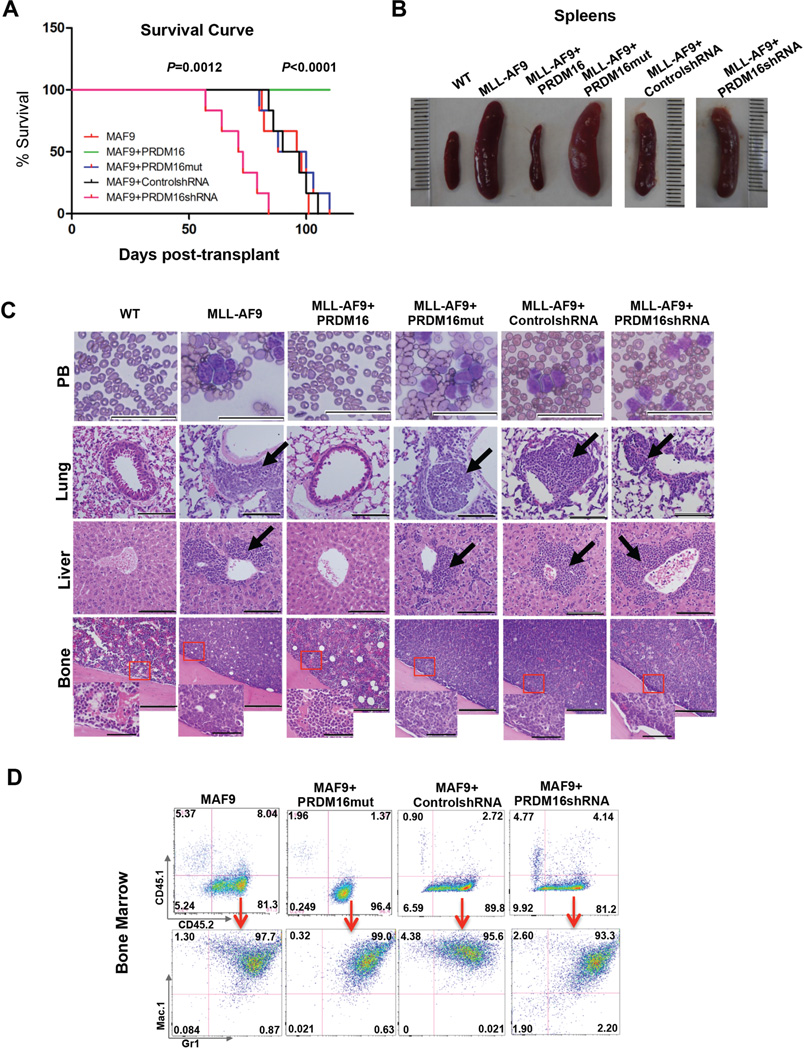
Figure 3. PRDM16 represses MLL-AF9 leukemia in vivo.
(See also Figure S2). A. Kaplan-Meier survival curves for recipient mice engrafted with cells as indicated (n=6). Mantel-Cox test was performed to obtain p values for overexpression (p<0.0001) and knockdown (p=0.0012) experiments, respectively. B. The representative images of the spleens from recipient mice at the end point of the study. C. Representative Wright-Giemsa staining of peripheral blood (PB) smear (Scan bar: 50µm) and H&E staining of lung (Scan bar: 100µm), liver (Scan bar: 100µm) and bone (Scan bar: 200um and 50µm) as indicated on right. Co-transduced genes were indicated on top. D. Representative flow cytometry analyses of bone marrow cells isolated for each group of recipient mice as indicated on top. Top row: antibodies against CD45.1 and CD45.2 surface markers to separate supporter cells and donor cells. Bottom row: antibodies against myeloid surface markers Mac-1 and Gr-1 to identify leukemic cell population. Percentage of cells for each immnophenotype was indicated in each quadrant.

