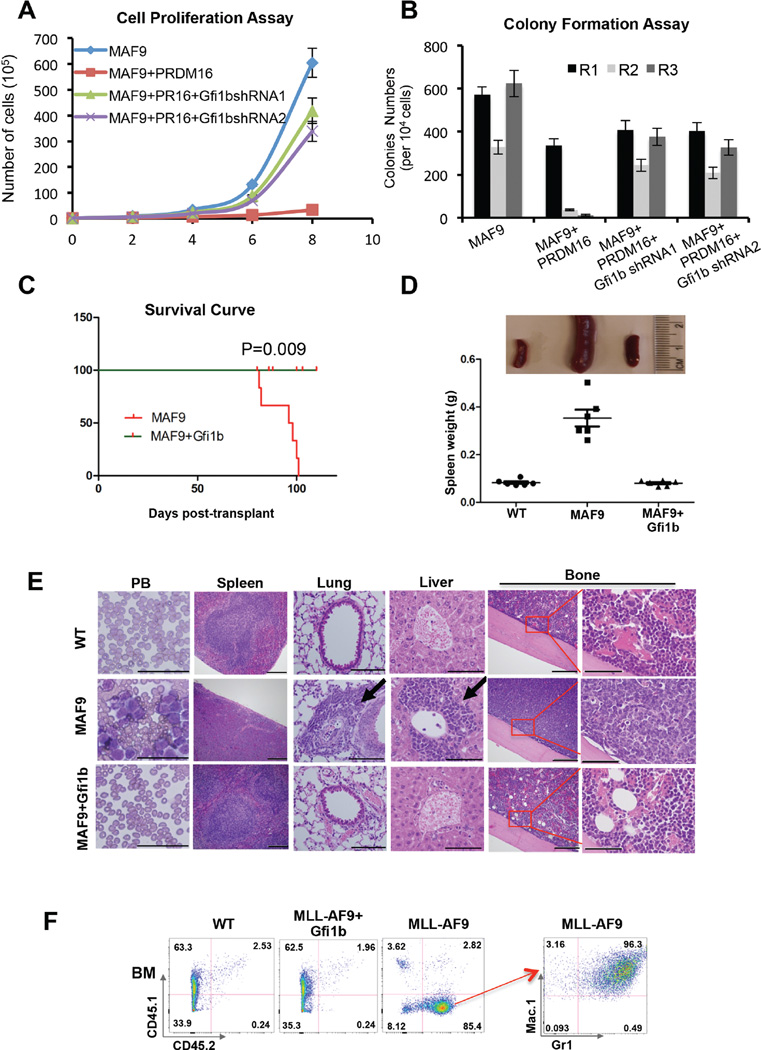
Figure 6. Gfi1b overexpression inhibits MLL-AF9 leukemogenesis.
(See also Figure S6). A. Liquid cell proliferation assays. Cell number (Y-axis) is counted every two days (X-axis). Error bars indicate SD from duplicates. The results were repeated at least three times. B. Myeloid colony formation assay. Colony counts from primary (R1), secondary (R2), and tertiary (R3) plating were summarized for each co-transduction as indicated on bottom. Means and SD (error bars) from duplicates were presented. The results were repeated at least three times. C. Kaplan-Meier survival curve of cohorts of recipient mice (n=6). p-value was calculated using the Mantel-Cox test. D. Top, representative image of spleens from the recipient mice. Bottom, the distribution of the spleen weight for each cohort. The MLL-AF9 cohort was the same as shown in Figure 3 since the experiments were performed at the same time. E. Wright-Giemsa staining of peripheral blood (PB) smear and histology of organs (H&E staining) of recipient mice (as indicated on top) at the end point of the study. Scan bars: 50µm for PB, 200µm for spleen, 100µm for lung and liver, 200µm and 50µm for bones. F. Representative flow cytometry analysis of BM cells in each cohort. Antibodies included CD45.1 vs. CD45.2 (left panels) and Mac-1 vs. Gr-1 (right panel) as indicated. Percentage of cell population was indicated in each quadrant.

